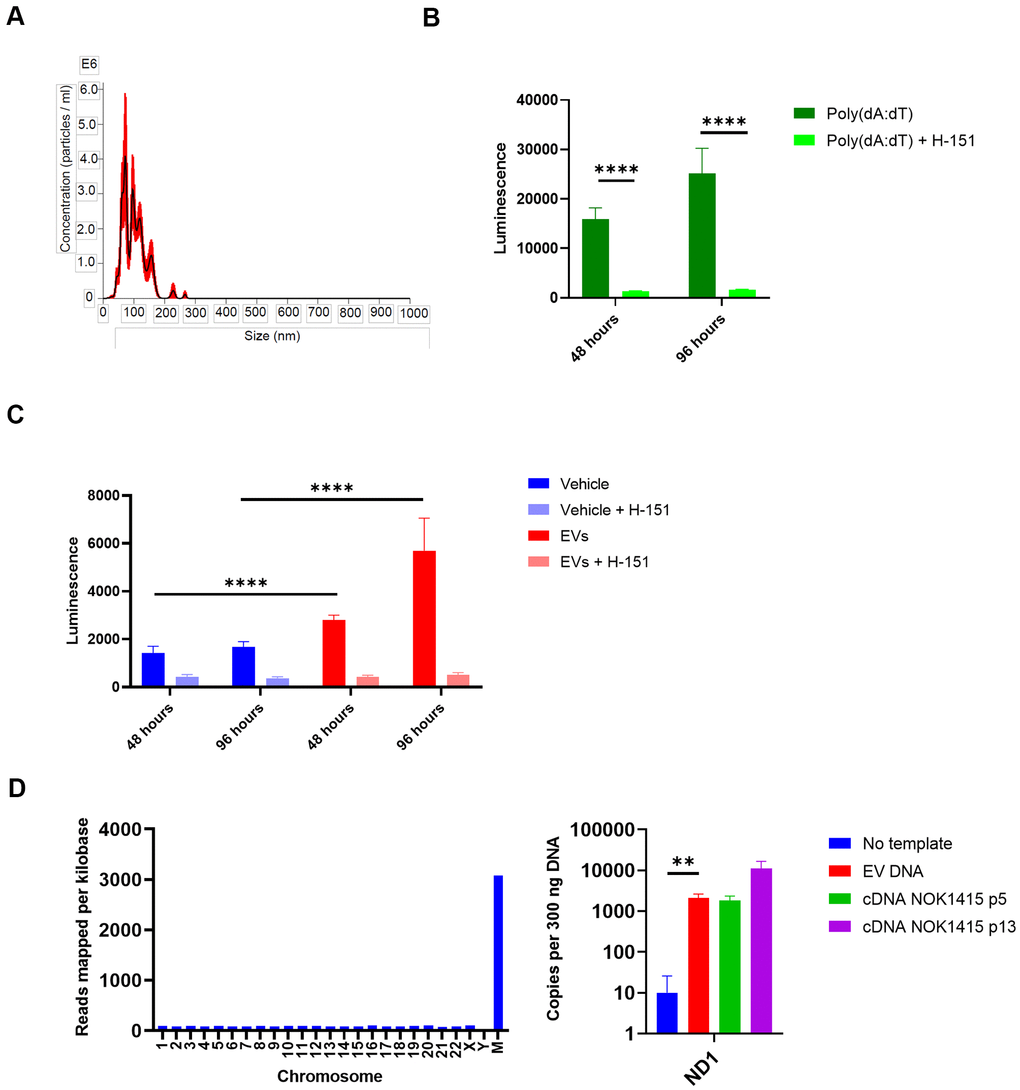
Figure 7.EVs from senescent NOKs activate IFN pathway signaling in THP-1 monocytes. (A) NanoSight analysis of EVs isolated by SEC shows vesicle size and quantity. (Error bars indicate +/-1 standard error of the mean.) (B) IFN transcription in THP-1 cells treated with poly (dA:dT). Over 96 hours, level was strongly reduced by the addition of the STING inhibitor H-151. (C) IFN transcription in THP-1 cells treated with EVs. Over 96 hours, level was significantly higher for cells co-incubated with EVs from senescent NOKs compared to vehicle-treated cells, and was significantly reduced by the addition of the STING inhibitor H-151. Results for Figure 7B, 7C show mean of 8 replicates for each condition ± SD. (D) DNA is associated with EVs from senescent NOKs. Left, DNA sequencing. Right, ddPCR results. No template reaction was negative control and cDNA from whole cell RNA was positive control. Readings in Figure 7B, 7C were normalized by subtracting mean luminescence of wells containing only Quanti-Luc reagent. Figure7B–7D significance levels determined using t-test. For Figure 7B–7D, *p<0.05, **p<0.01, ***p<0.001, ****p<0.0001.