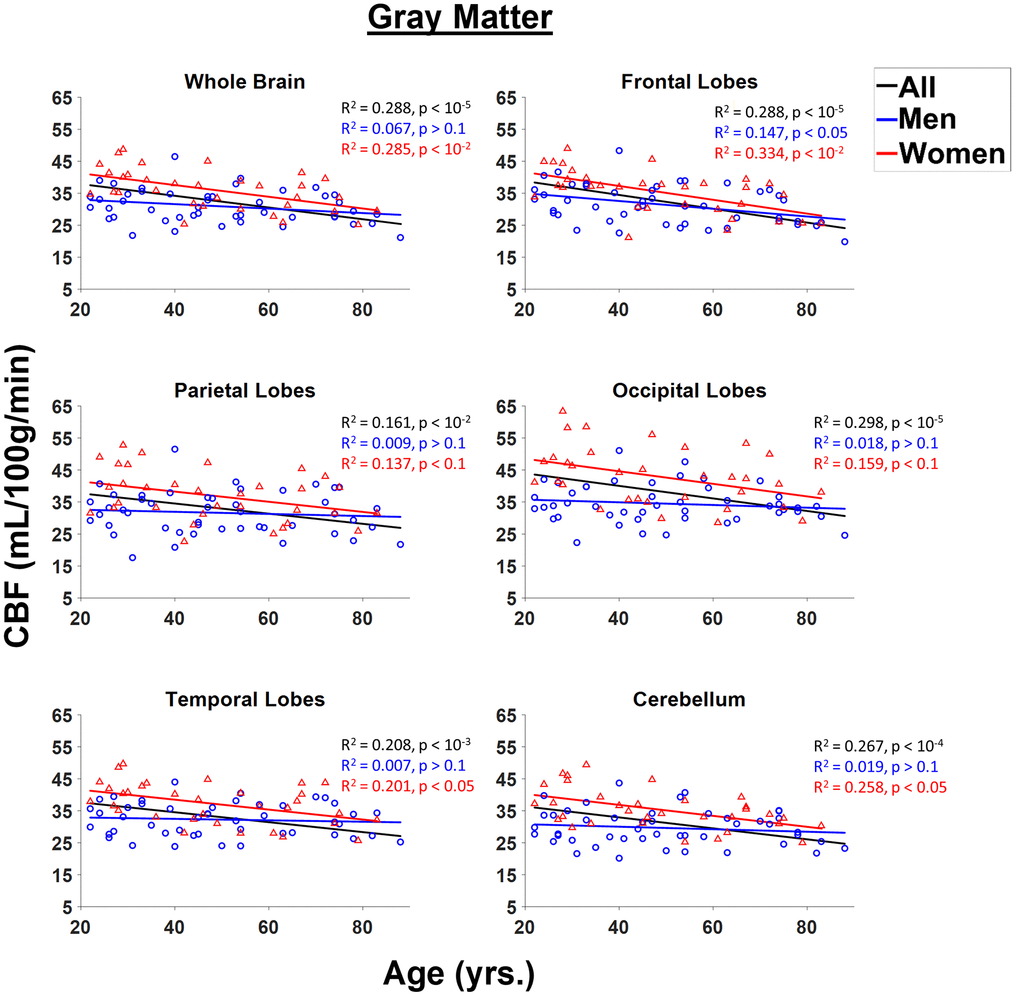
Figure 2.Regressions of NESMA-CBF with age and sex shown for the six gray matter (GM) regions investigated. For each structure, the coefficient of determination, R2, and p-value, obtained after FDR correction, are reported. Most regions investigated showed linearly decreasing CBF with age.