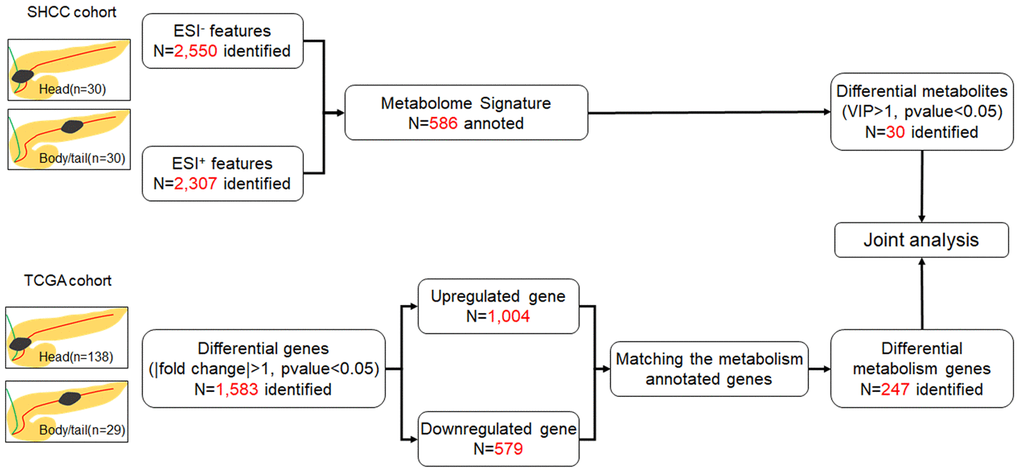
Figure 1.Flow chart of the study. The SHCC cohort and TCGA cohort were applied for metabolome and transcriptome analysis, respectively, and then joint analysis was performed. The pancreatic cancer was divided into head and body/tail groups, based on the anatomic location.