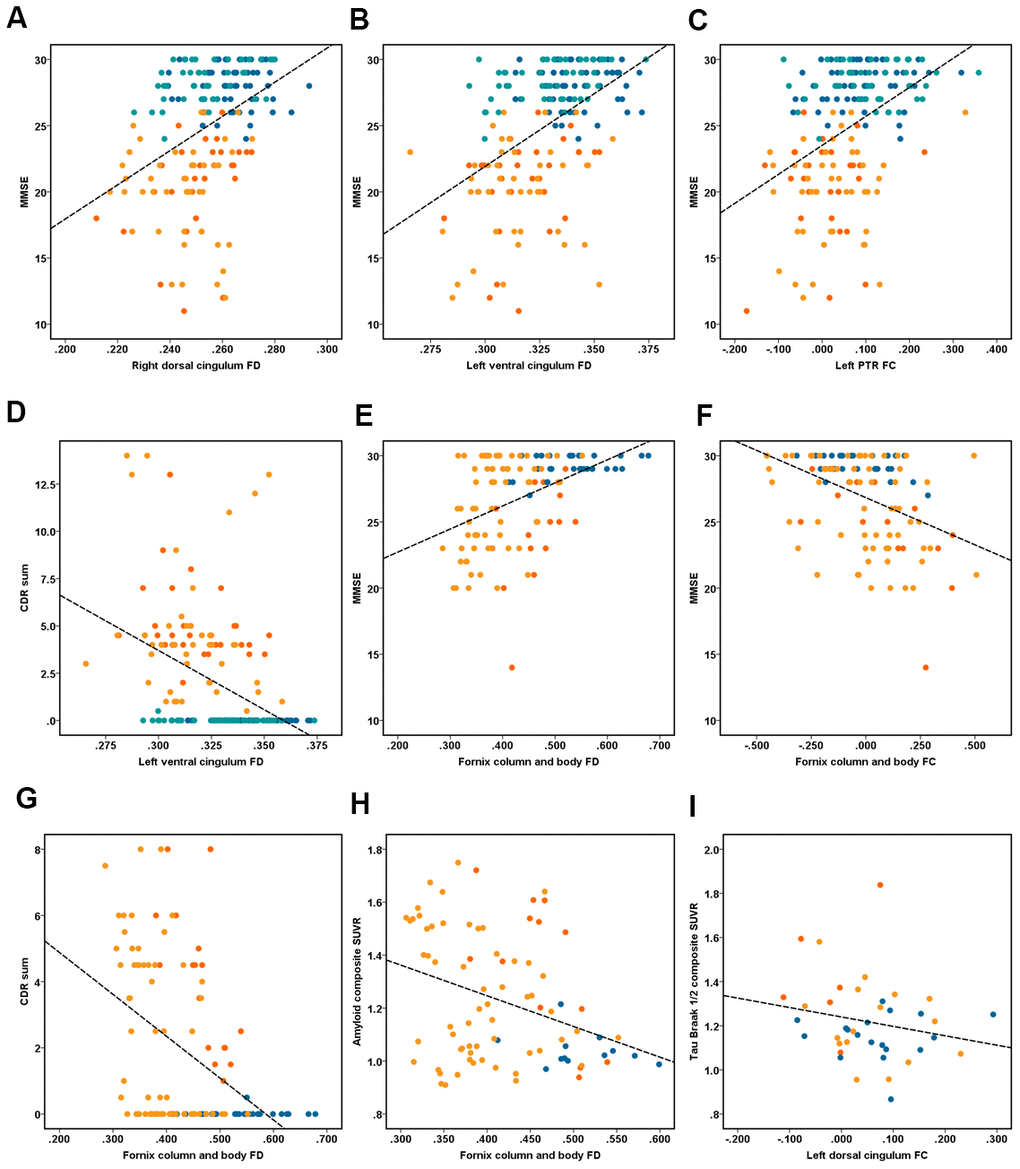
Figure 3.Illustrates the association between fixel-based analysis metrics and clinical data. Correlation analyses of (A–D) performed in the ZJU database. (A) Right dorsal cingulum fiber density (FD) related with MMSE (r = 0.40, P < 0.001); (B) left ventral cingulum FD related with MMSE (r = 0.48, P < 0.001); (C) left PTR fiber bundle cross-section (FC) related with MMSE (r = 0.43, P < 0.001); (D) left ventral cingulum FD related with CDR sum (r = 0.42, P < 0.001). Correlation analyses of (E–I) performed in the ADNI database. (E) Fornix column and body FD related with MMSE (r = 0.45, P < 0.001); (F) fornix column and body FC related with MMSE (r = -0.42, P < 0.001); (G) fornix column and body FD related with CDR sum (r = -0.45, P < 0.001); (H) fornix column and body FD related with composite amyloid SUVR (r = -0.34, P < 0.001); (I) right ventral cingulum FC related with tau Braak I/II composite SUVR (r = -0.53, P < 0.001). Note: dot of red, orange, dark blue and light blue represent the early-onset Alzheimer’s disease (EOAD), late-onset Alzheimer’s disease (LOAD), young healthy controls (YHC), and old healthy controls (OHC).