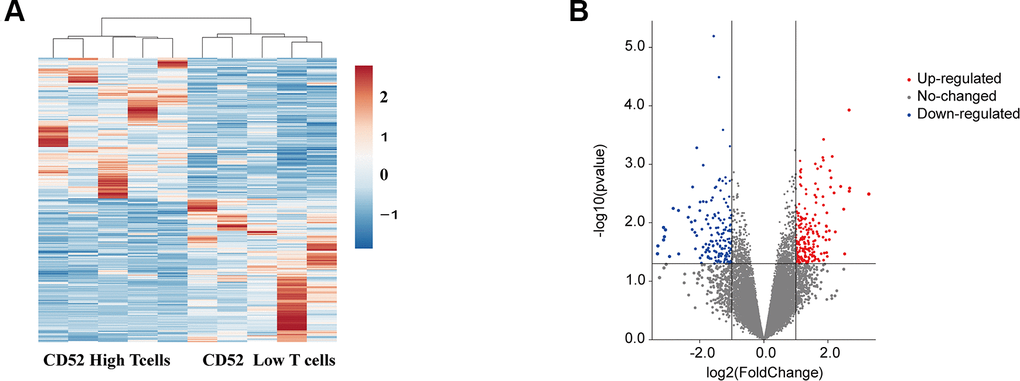
Figure 4.Identification of differentially expressed mRNAs in different CD4+ T cells. (A) Clustered heat map of the differentially expressed mRNAs between CD52high T cells CD52 low T cells. up-regulated mRNAs are shown in red, and down-regulated mRNAs are shown in blue. (B) Volcano plots comparing the expression of mRNAs in between CD52high T cells CD52 low T cells. The red dots represent the significantly up-regulated differentially expressed mRNAs (fold-change ≥ 2 and P < 0.05), the blue dots represent the significantly down-regulated differentially expressed mRNAs (fold-change ≤ -2 and P < 0.05).