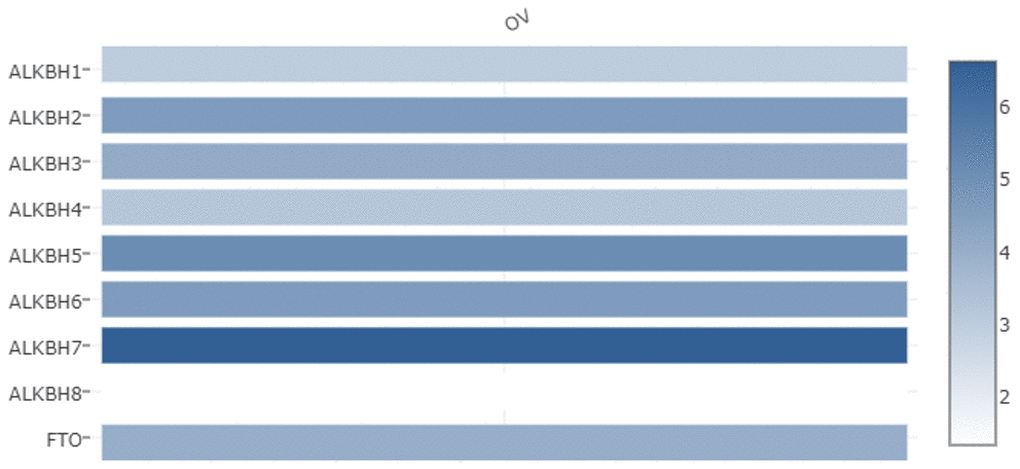
Figure 2.The relative expression levels of the AlkB family in OV patients. GEPIA databases were used to evaluate the relative expression levels of the AlkB family in OV patients.
Figure 2 — Expression and molecular profiles of the AlkB family in ovarian serous carcinoma | Aging