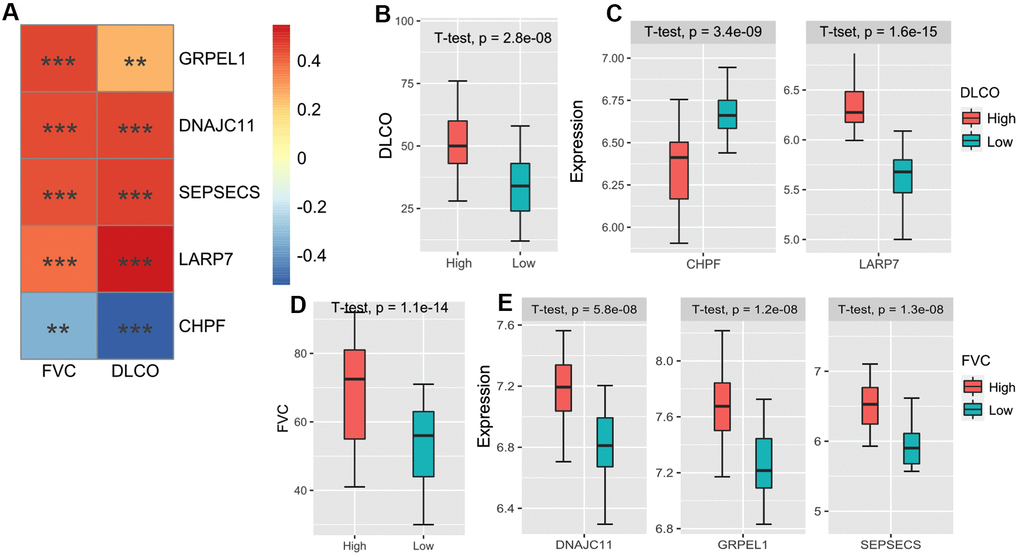
Figure 6.(A) The heatmap of the correlations between the 5 m6A-related-CoV genes and FVC/DLCO in the GSE38958 validation cohort. (B) The box plot shows the difference of the DLCO between high DLCO and low DLCO clusters. (C) The box plot shows the different expressions of LARP7 and CHPF between high DLCO and low DLCO clusters. (D) The box plot shows the difference of FVC between high FVC and low FVC clusters. (E) The box plot shows the different expressions of GRPEL1, DNAJC11, and SEPSECS between high FVC and low FVC clusters.