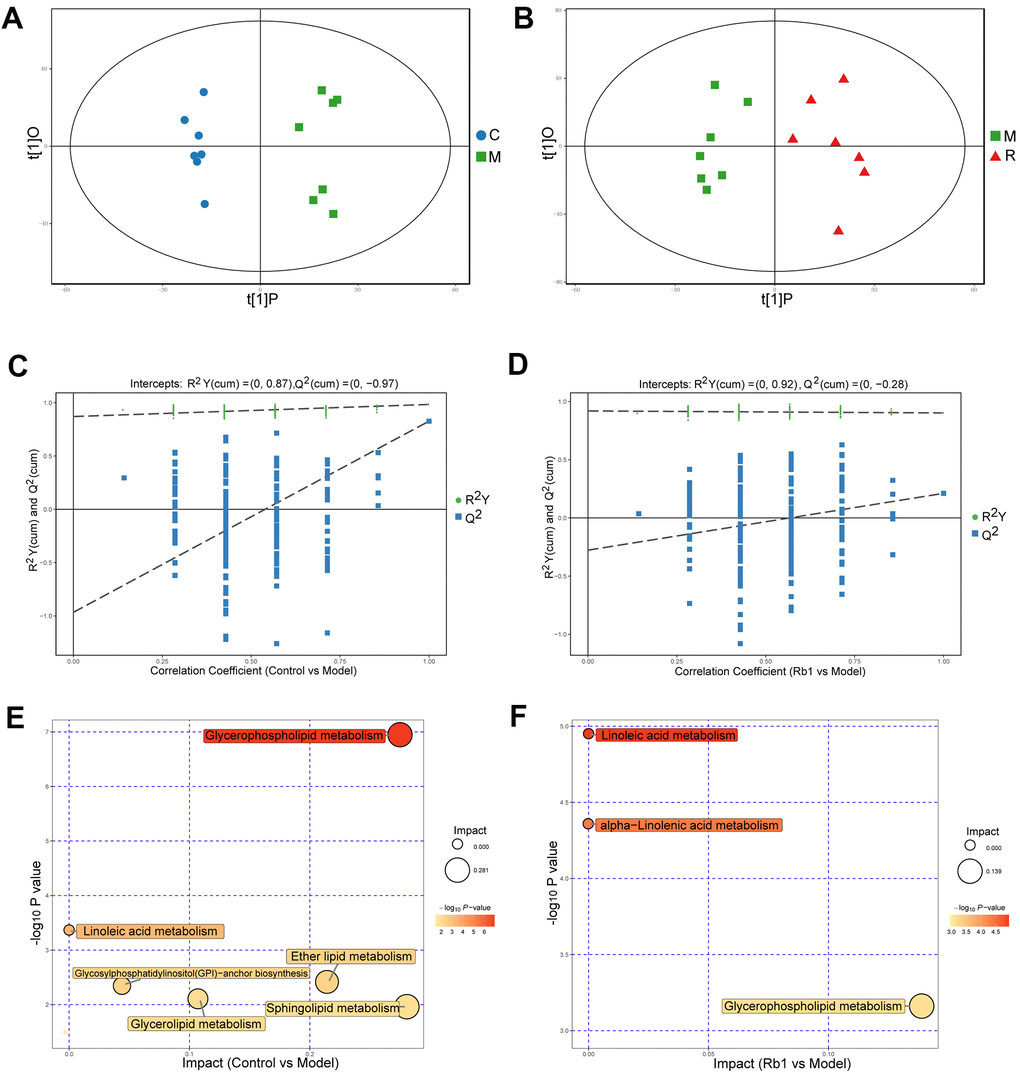
Figure 2.Characteristics of lipidomics in positive ion model. (A) Score scatter plot of OPLS-DA model for group C vs M in POS model. The X axis t [1] P denotes the predicted principal component score of the first principal component, the Y axis t [1] O denotes the orthogonal principal component scores. The two groups of samples are very distinct in this model. C, control group. M, model group. POS, positive ion model. (B) Score scatter plot of OPLS-DA model for group M vs R in POS. M, model group. R, Rb1 group. POS, positive ion model (C) Permutation test of OPLS-DA model for group Control vs Model in POS. The X axis represents the replacement retention, the Y axis represents the value of R2Y or Q2, the green dot represents the value of R2Y and the blue square represents the value of Q of the replacement test. The dotted lines represent the regression lines of R Y and Q, respectively. The original model can well explain the difference between the two groups of samples. (D) Permutation test of OPLS-DA model for group Rb1 vs Model in POS. (E) Pathway analysis for group Control vs Model in POS. The bubble size indicates the influencing factor in the topological analysis; the bubble color represents the P value of enrichment analysis. (F) Pathway analysis for group Rb1 ve Model in POS.