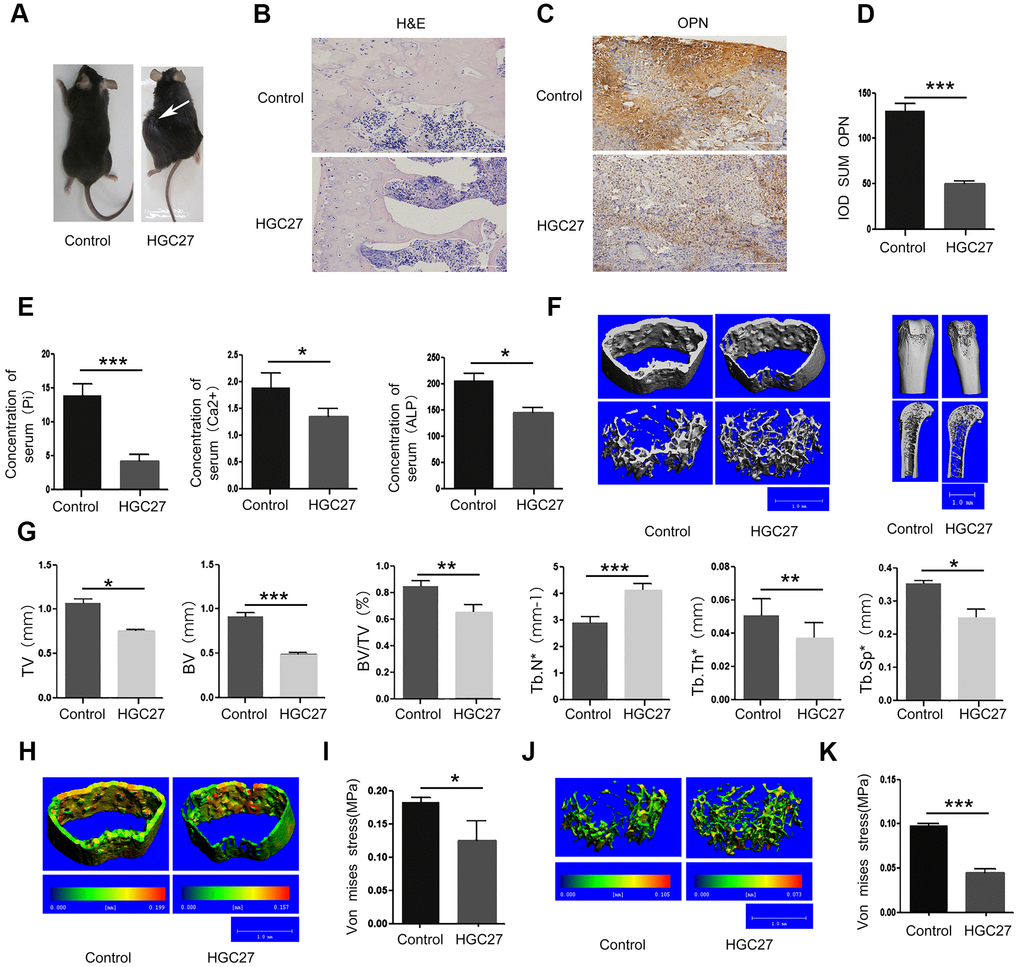
Figure 2.Injection of C57BL mice with HGC27 cells in vivo confirms that gastric cancer induces bone loss. (A) C57BL mice were injected with HGC27 cells or PBS (control). Mice were observed for 90 days following the injection. The white arrow indicates the localization of the gastric tumor. (B) H&E staining of isolated femurs from the control group and the experimental group. Scale bar, 100μm. (C) Immunohistochemical staining of osteopontin (OPN) from representative normal and damaged femoral tissues. The brown color indicates OPN-positive cells. Scale bar, 100 μm. (D) Comparison of IOD SUM of OPN-positive cells in (C). (E) Peripheral blood of C57BL mice injected with PBS or HGC27 cells was collected 90 days post-injection for determination of serum phosphorus (Pi), calcium (Ca2+) and alkaline phosphatase (ALP) respectively. (F) Micro-CT showing the transverse section and longitudinal section of the femur. (G) Quantitative analysis of the percentage of total bone mass (TV), bone mass (BV), bone volume to total bone volume (BV/TV), trabecular number (Tb.N*), trabecular thickness (Tb.Th*) and trabecular spacing (Tb.Sp*) in femurs from the two groups at day 90. (H) Micro-CT showing a comparison of the stress levels of the femoral cortical bone. (I) Quantitative analysis of the ability of the femoral cortex to withstand stress. (J) Micro-CT showing a comparison of the stress tolerance of the femoral trabecular cancellous bone. (K) Quantitative analysis of the femoral trabecular cancellous bone portion subjected to stress. Data are shown as mean±SEM. Statistical differences were obtained using a Student's t-test, *, p<0.05, **, p<0.01, ***, p<0.001. n=3 per-group.