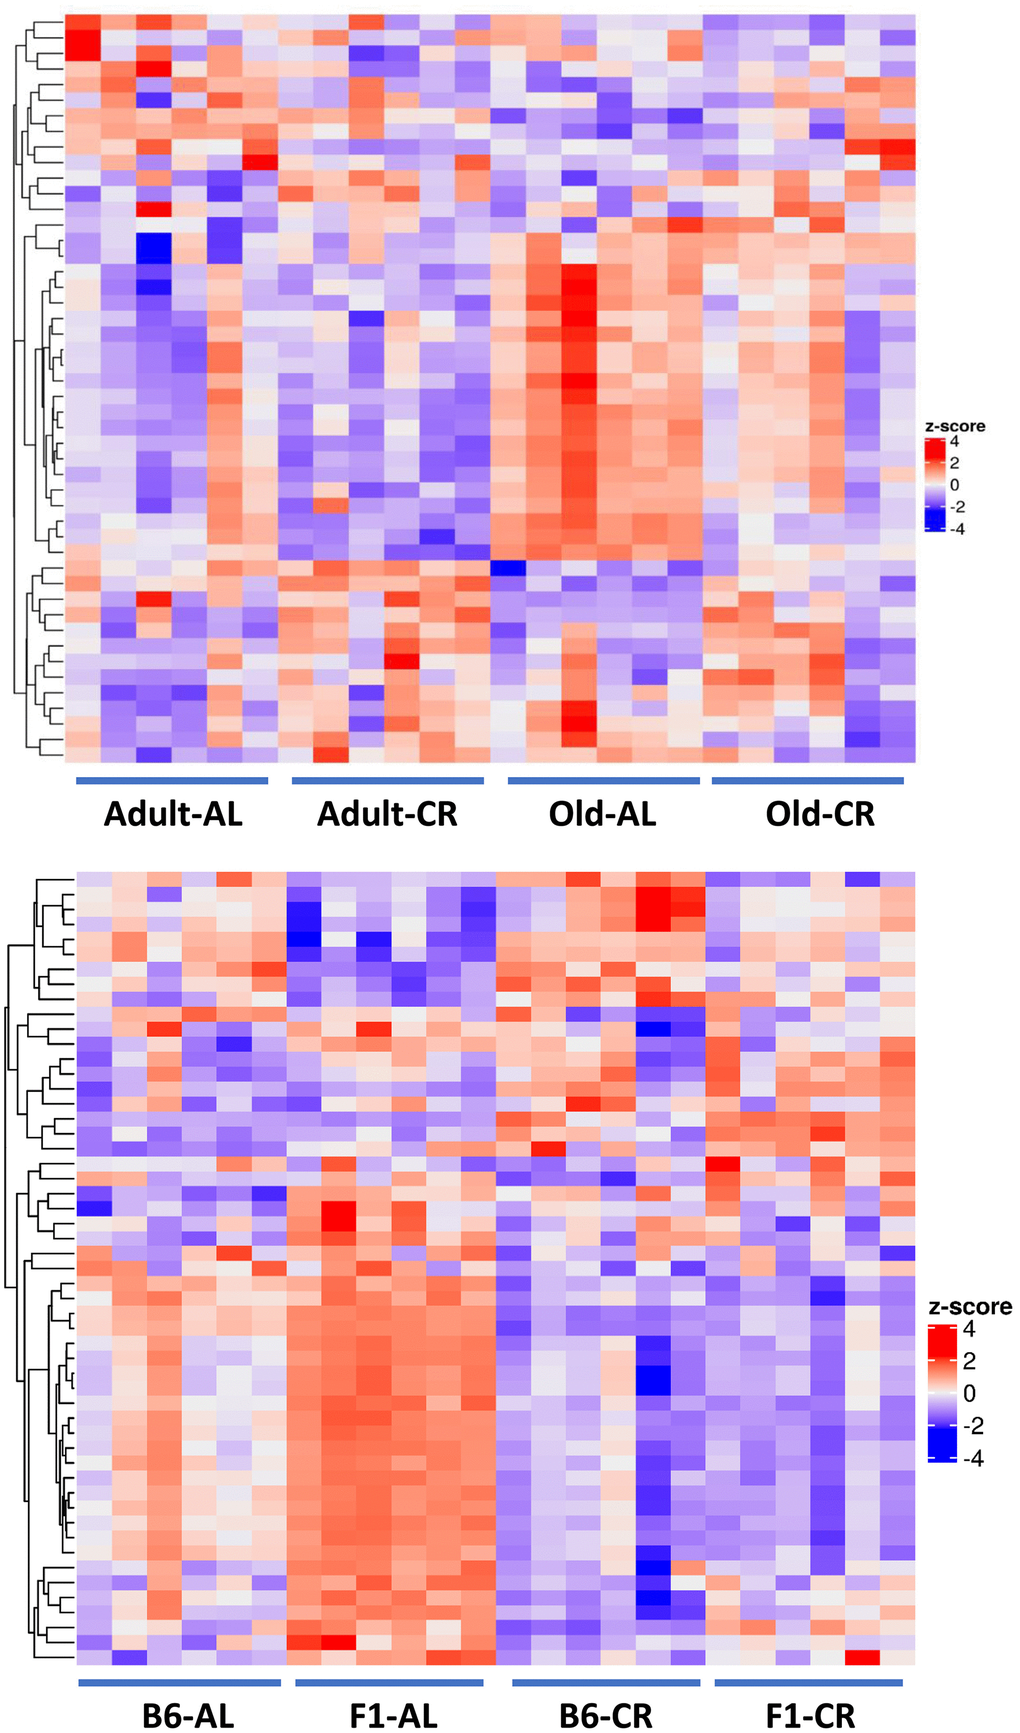
Figure 8.Heatmaps of the fecal metabolome. Top Panel: Heatmap of the 48 metabolites that changed significantly (FDR <0.05) with either Old AL vs. Adult AL or Old AL vs. Old CR comparisons in C57BL/6JN mice (6 mice per group). Bottom Panel: The heatmap shows the relative levels of the 53 metabolites that changed significantly (FDR <0.05) with CR in either old C57BL/6JN or old B6D2F1 mice (6 mice per group). In order to generate the heatmap, we computed a z-score of the log2-abundance, where we adjusted the data, by metabolites, to have a mean of zero and a standard deviation of 1. The heatmap is generated using the Complex Heatmap R package, where the metabolites were clustered via the hclust function with the “complete” agglomeration method. Distance matrix for clustering are computed using “Euclidean” distance. The resulting heatmap presents the metabolites in rows and samples in columns.