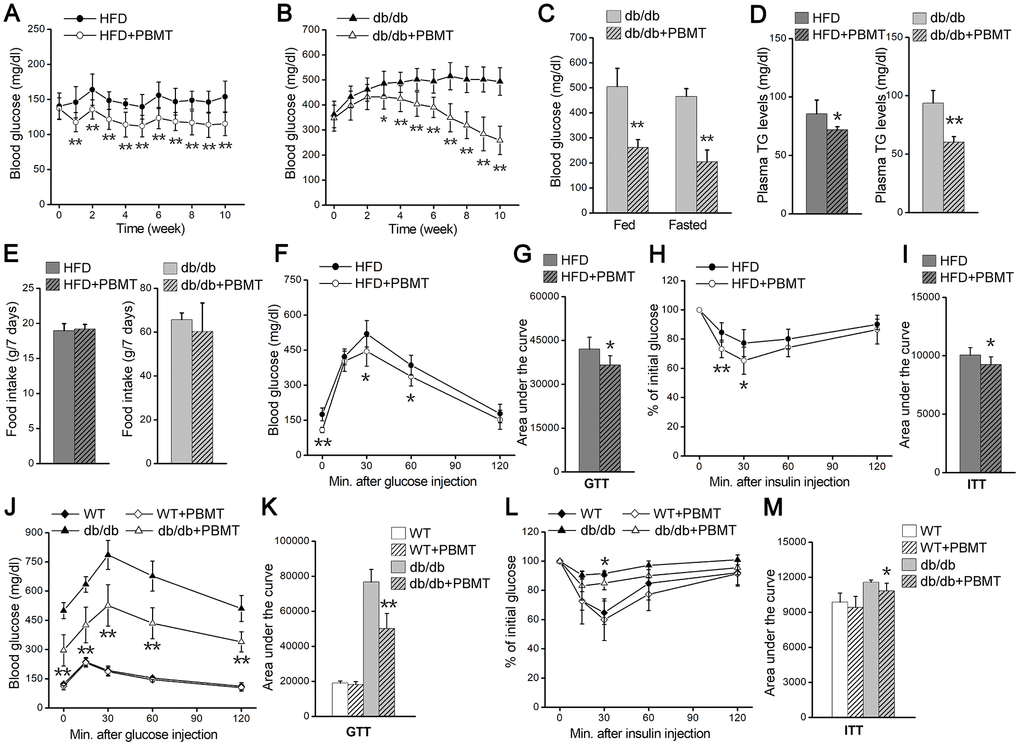
Figure 1.PBMT reduces blood glucose and insulin resistance in mouse models. (A, B) Fasting blood glucose curves of HFD-fed mice (n =7–10) (A) and db/db mice (n = 8–10) (B) with or without PBMT (635 nm, 72.1 mW/cm2, 10 min; 8 J/cm2) for 10 weeks. Blood glucose was examined 12 hours after the last PBMT. Mean ± SD. *p < 0.05, **p < 0.01 vs. the PBMT-untreated mice (Student’s t-test). (C) Blood glucose in db/db mice treated with or without PBMT for 10 weeks. Blood glucose was examined 12 hours after the last PBMT. Mean ± SD, n = 5. **p < 0.01 vs. the db/db mice (Student’s t-test). (D) Plasma TG levels in HFD-fed mice and db/db mice treated with or without PBMT for 10 weeks. Plasma TG was examined 12 hours after the last PBMT. Mean ± SD, n = 5. *p < 0.05, **p < 0.01 vs. the PBMT-untreated mice (Student’s t-test). (E) Food intake for 7 days in PBMT-untreated or -treated HFD-fed mice and db/db mice for 10 weeks. Mean ± SD, n = 5. (F, G) GTTs (F) and area under the curve (above baseline glucose in GTTs) (G) in HFD-fed mice treated with or without PBMT for 10 weeks. The experiences were performed 12 hours after the last PBMT. Mean ± SD, n = 7. *p < 0.05, **p < 0.01 vs. the HFD mice (Student’s t-test). (H, I) ITTs (H) and area under the curve (above baseline glucose in ITTs) (I) in HFD-fed mice treated with or without PBMT for 10 weeks. The experiences were performed 12 hours after the last PBMT. Mean ± SD, n = 7. *p < 0.05, **p < 0.01 vs. the HFD mice (Student’s t-test). (J, K) GTTs (J) and area under the curve (K) in wild type (WT) and db/db mice treated with or without PBMT for 10 weeks. The experiences were performed 12 hours after the last PBMT. Mean ± SD, n = 5. **p < 0.01 vs. the db/db mice (Student’s t-test). (L, M) ITTs (L) and area under the curve (M) in WT and db/db mice with or without PBMT for 10 weeks. The experiences were performed 12 hours after the last PBMT. Mean ± SD, n = 5. *p < 0.05 vs. the db/db mice (Student’s t-test).