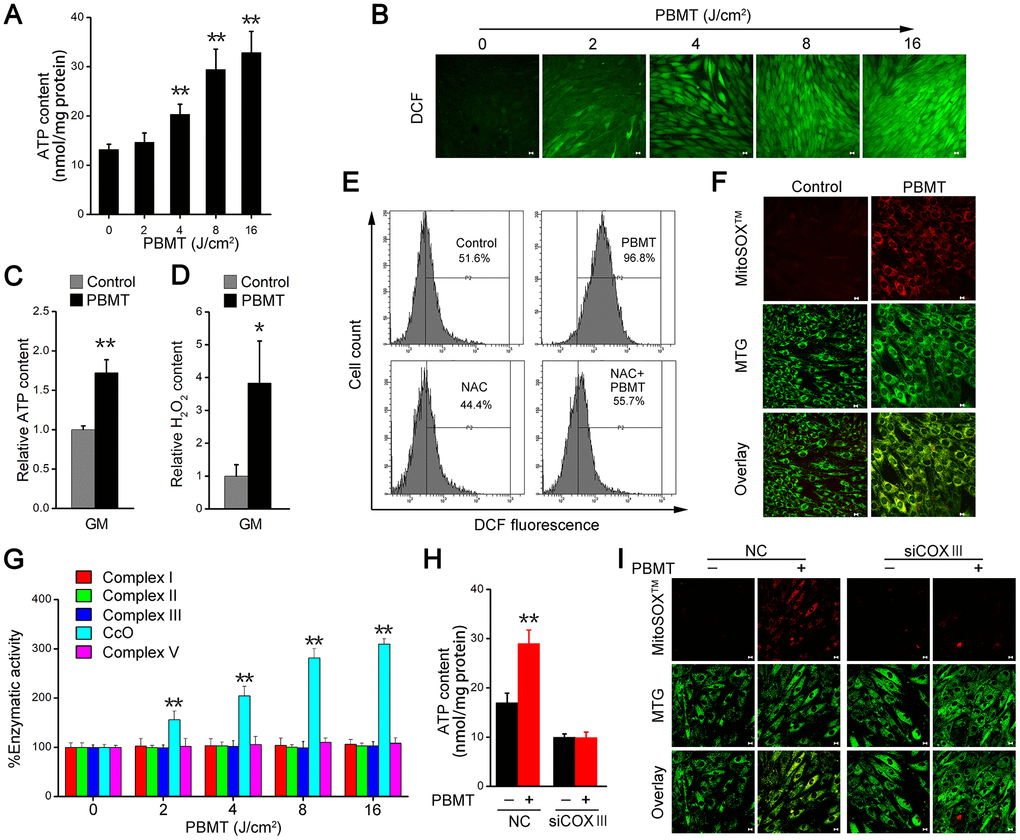
Figure 3.PBMT facilitates ATP and ROS generation by increasing mitochondrial CcO activity. (A) Intracellular ATP content in IR-L6 myotubes 15 min after the indicated doses of PBMT. Mean ± SD, n = 4. **p < 0.01 vs. the PBMT-untreated group (Student’s t-test). (B) Monitoring of ROS generation stimulated by the indicated doses of PBMT in IR-L6 myotubes. ROS (green) was stained with H2DCFDA. Scale bar, 10 μm. (C, D) Intracellular ATP (C) and H2O2 (D) content in GMs 15 min after 8 J/cm2 PBMT. Mean ± SD, n = 4. **p < 0.01 vs. the control group (Student’s t-test). (E) Flow cytometry (FACS) analysis of ROS generation in IR-L6 myotubes 15 min after the indicated treatments. Cells were pre-cultured with N-acetylcysteine (NAC; 250 μM) 1 h before PBMT. Mean ± SD, n = 3. *p < 0.05, **p < 0.01 vs. the control group; ##p < 0.01 vs. the indicated group (Student’s t-test). (F) Representative fluorescence images of O2•– (red) and mitochondria (green) in IR-L6 myotubes treated with or without 8 J/cm2 PBMT. O2•– was stained with MitoSOXTM; mitochondria were stained with MitoTracker Green (MTG). Scale bar, 10 μm. (G) Enzymatic activity of Complex I, II, III, CcO, and V in IR-L6 myotubes after the indicated doses of PBMT. Mean ± SD, n = 4. **p < 0.01 vs. the PBMT-untreated group (Student’s t-test). (H, I) Intracellular ATP content (H) and representative fluorescence images of O2•– (red) and mitochondria (green) (I) in IR-L6 myotubes transfected with negative-control siRNA (NC) or COXIII siRNA (siCOXIII) 15 min after 8 J/cm2 PBMT. Mean ± SD, n = 4. **p < 0.01 vs. the PBMT-untreated groups (Student’s t-test). Scale bar, 10 μm.