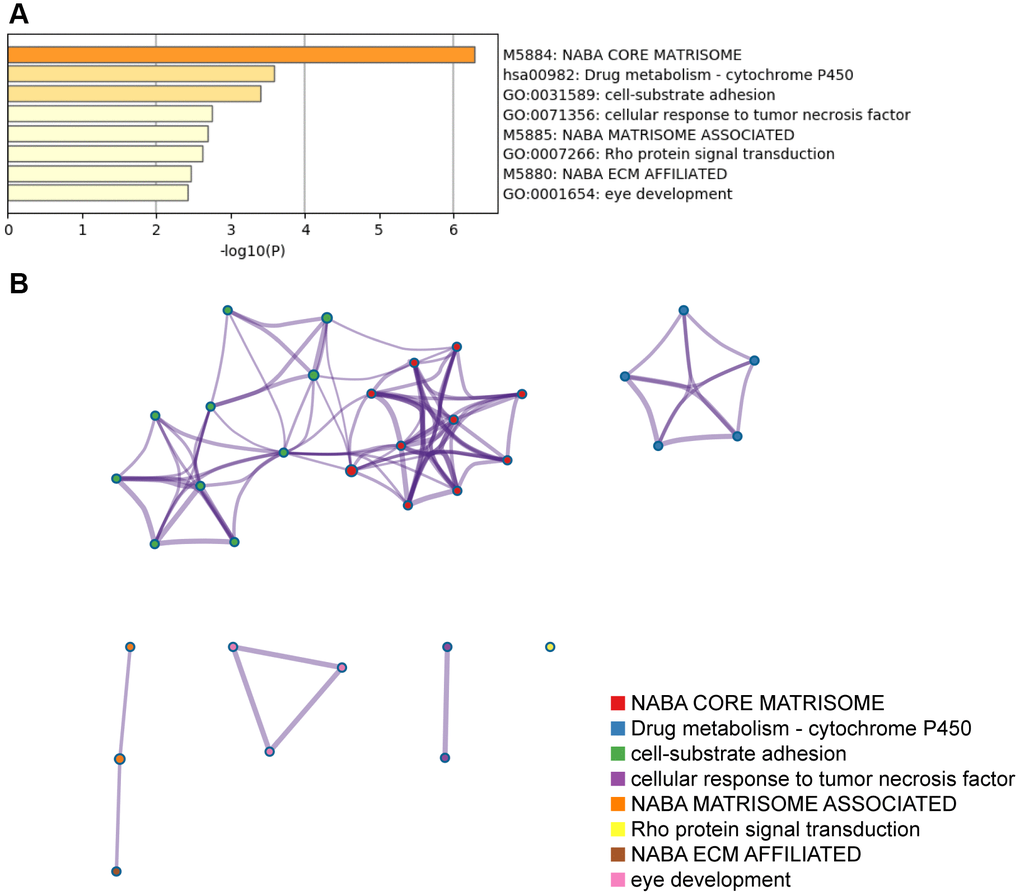
Figure 5.The top GO terms and pathways related to top 100 NID1-related genes in GBM tissues. (A) Heatmap shows top GO terms and (KEGG/Canonical) pathways related to the top 100 NID1-related genes expressed in GBM tissues. The -log10P values are plotted on the X-axis. (B) The network of enriched gene sets representing the top 100 NID1-related genes expressed in GBM tissues.