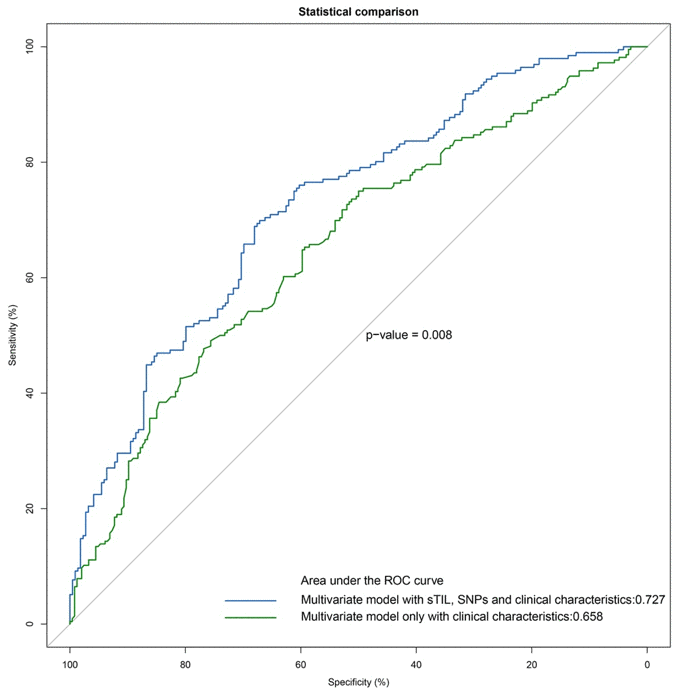
Figure 2.ROC analyses of esophageal squamous cell carcinoma (ESCC) patients. Additive prognostic value of SNPs and sTIL in patients with ESCC by comparison of area under the ROC curve (AUC) for (1) multivariate model with sTIL, SNPs and clinical characteristics, (2) multivariate model only with clinical characteristics.