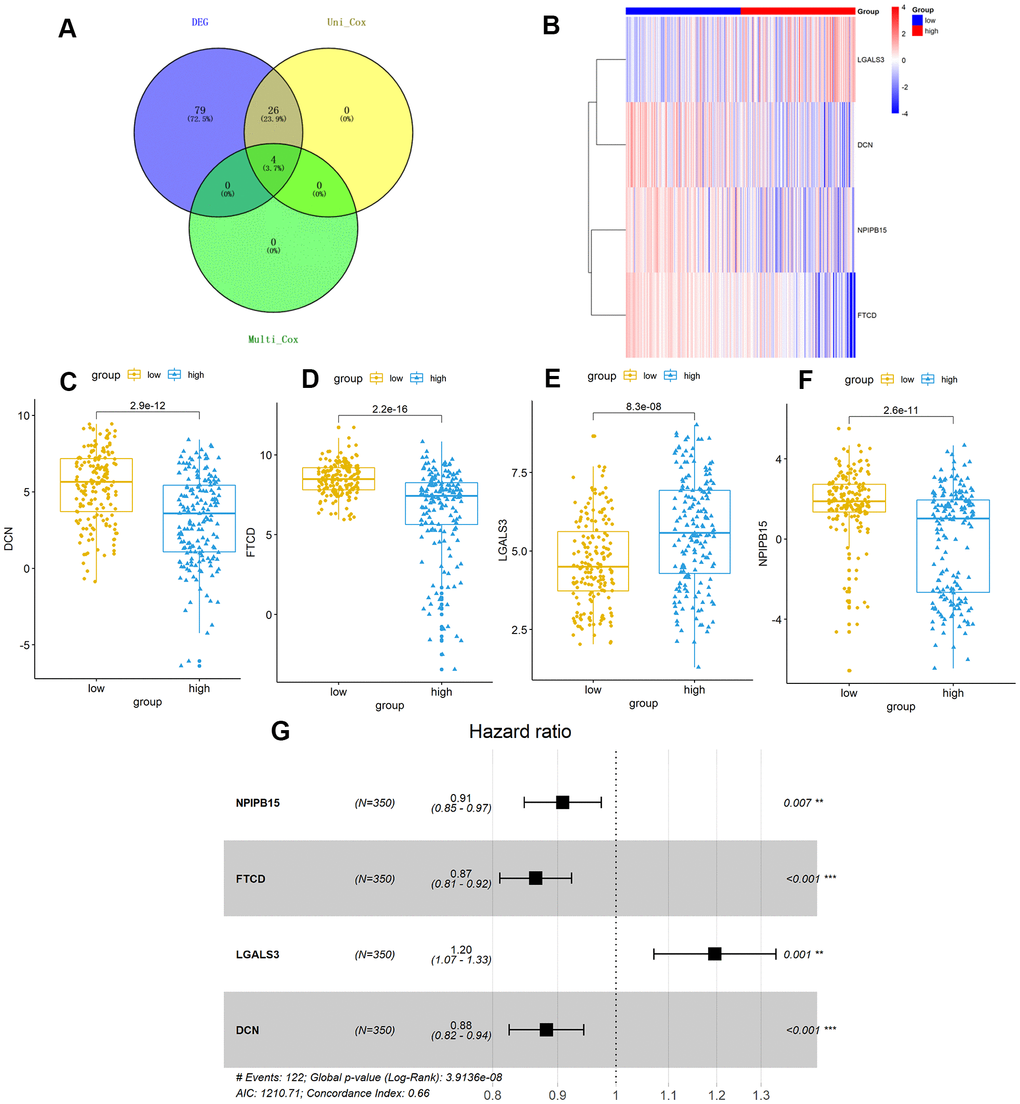
Figure 5.TMB-related hub-genes analysis. (A) Four TMB-related hub-genes were obtained with stepwise regression screening. (B) The four TMB-related hub-genes were shown in the heatmap plot. Vertical and horizontal axes represent TMB-related hub-genes and HCC samples respectively, as ranked by TMB value. Genes with higher and lower levels are shown in red and blue, respectively. Color bars at the top of the heat map represent sample types, with red and blue indicating high- and low-TMB samples, respectively. (C–F) LGALS3 (E) had higher expression in high-TMB group (P < 0.01), while DCN (C), FTCD (D), and NPIPB15 (F) were negatively correlated with high-TMB (P < 0.01). (G) Calculated by Cox multivariate model, hazard ratio with 95% confidence interval (95% CI) for each independent TMB-related signature are shown in forest plot. TMB, tumor mutation burden; HCC, hepatocellular carcinoma.