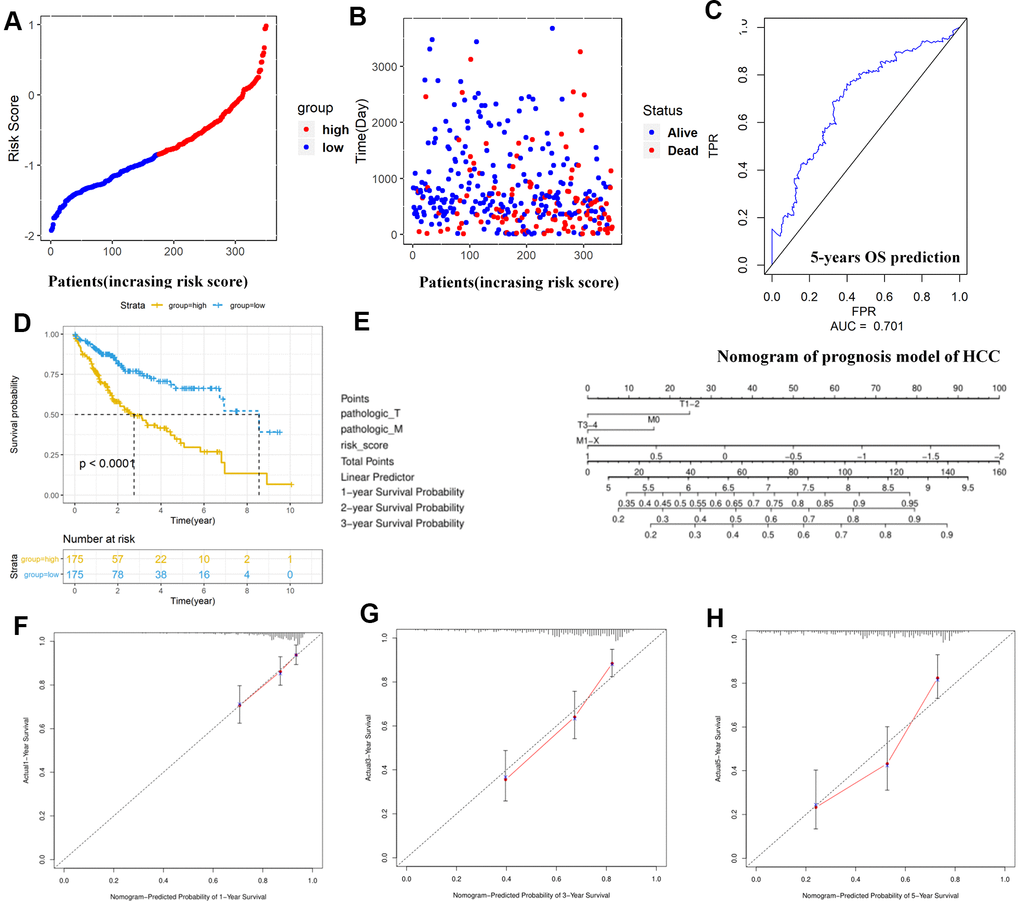
Figure 6.Construction and assessment of TMBPM for HCC. (A, B) Distribution of the risk score for each HCC patient as per the TMBPM levels. Vertical and horizontal axes respectively represent risk score and OS patients, as ranked by increasing risk score. Red and blue colors respectively represent high and low risk cases. (B) Dot plot of Survival time for each HCC patient as per the TMBPM levels. Vertical and horizontal axes respectively represent survival times and OS patients, as ranked by increasing risk score. Read and blue colors represent dead and living OS cases, respectively. (C) Horizontal and vertical axes are false positive rates and true positive rates, respectively. The AUC value of the ROC plot was 0.701 that showed superior predictive accuracy of TMBPM. (D) Kaplan-Meier analysis demonstrated that higher TMBPMs showed worse OS with P < 0.0001. (E) Nomogram of the prognosis model of HCC. (F–H) All the calibration curves of 1-year (F), 3-year (G), and 5-year (H) prognosis model fitted well. HCC, hepatocellular carcinoma; TMBPM, tumor mutation burden prognostic model; OS, overall survival; ROC, receiver operating characteristic; AUC, area under the curve; TPR, true positive rates; FPR, false positive rates.