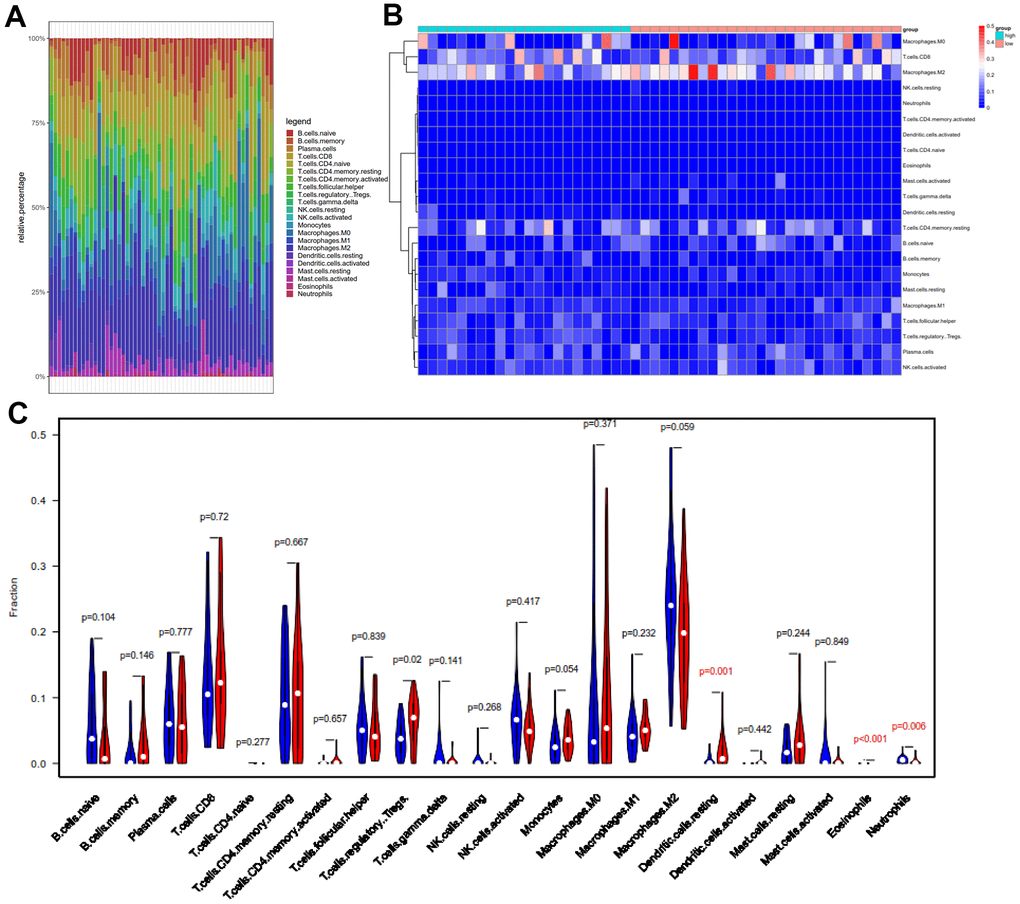
Figure 7.Comparison of 22 important tumor-infiltrating immune Cells (TIICs) between the low-TMB and high-TMB groups. (A) Barplot exhibited the proportion of 22 kinds of TIICs in HCC tumor samples, and the different colors represent the 22 TIICs. Vertical and horizontal axes represent relative percentage and patients, respectively. (B) Differential abundances of TIICs in the two groups are shown in the heatmap plot. Vertical and horizontal axes represent TIICs and patients, respectively. TIICs with higher and lower correlation levels are shown in red and blue, respectively. Color bars at the top of the heat map represent sample types, with pink and blue indicating low- and high-TMB samples, respectively. (C) The violin plot compared the proportions of 22 TIICS between low-TMB and high-TMB groups. Blue and red colors represent low- and high-TMB patients, respectively. Vertical and horizontal axes respectively represent TIICs fraction and TIICs, respectively. The Wilcoxon rank-sum test revealed that the infiltration levels of T cells regulatory (Tregs), dendritic cells resting and eosinophils were higher in the high-TMB group. TMB, tumor mutation burden; TIICs, tumor-infiltrating immune Cells; Tregs, T cells regulatory.