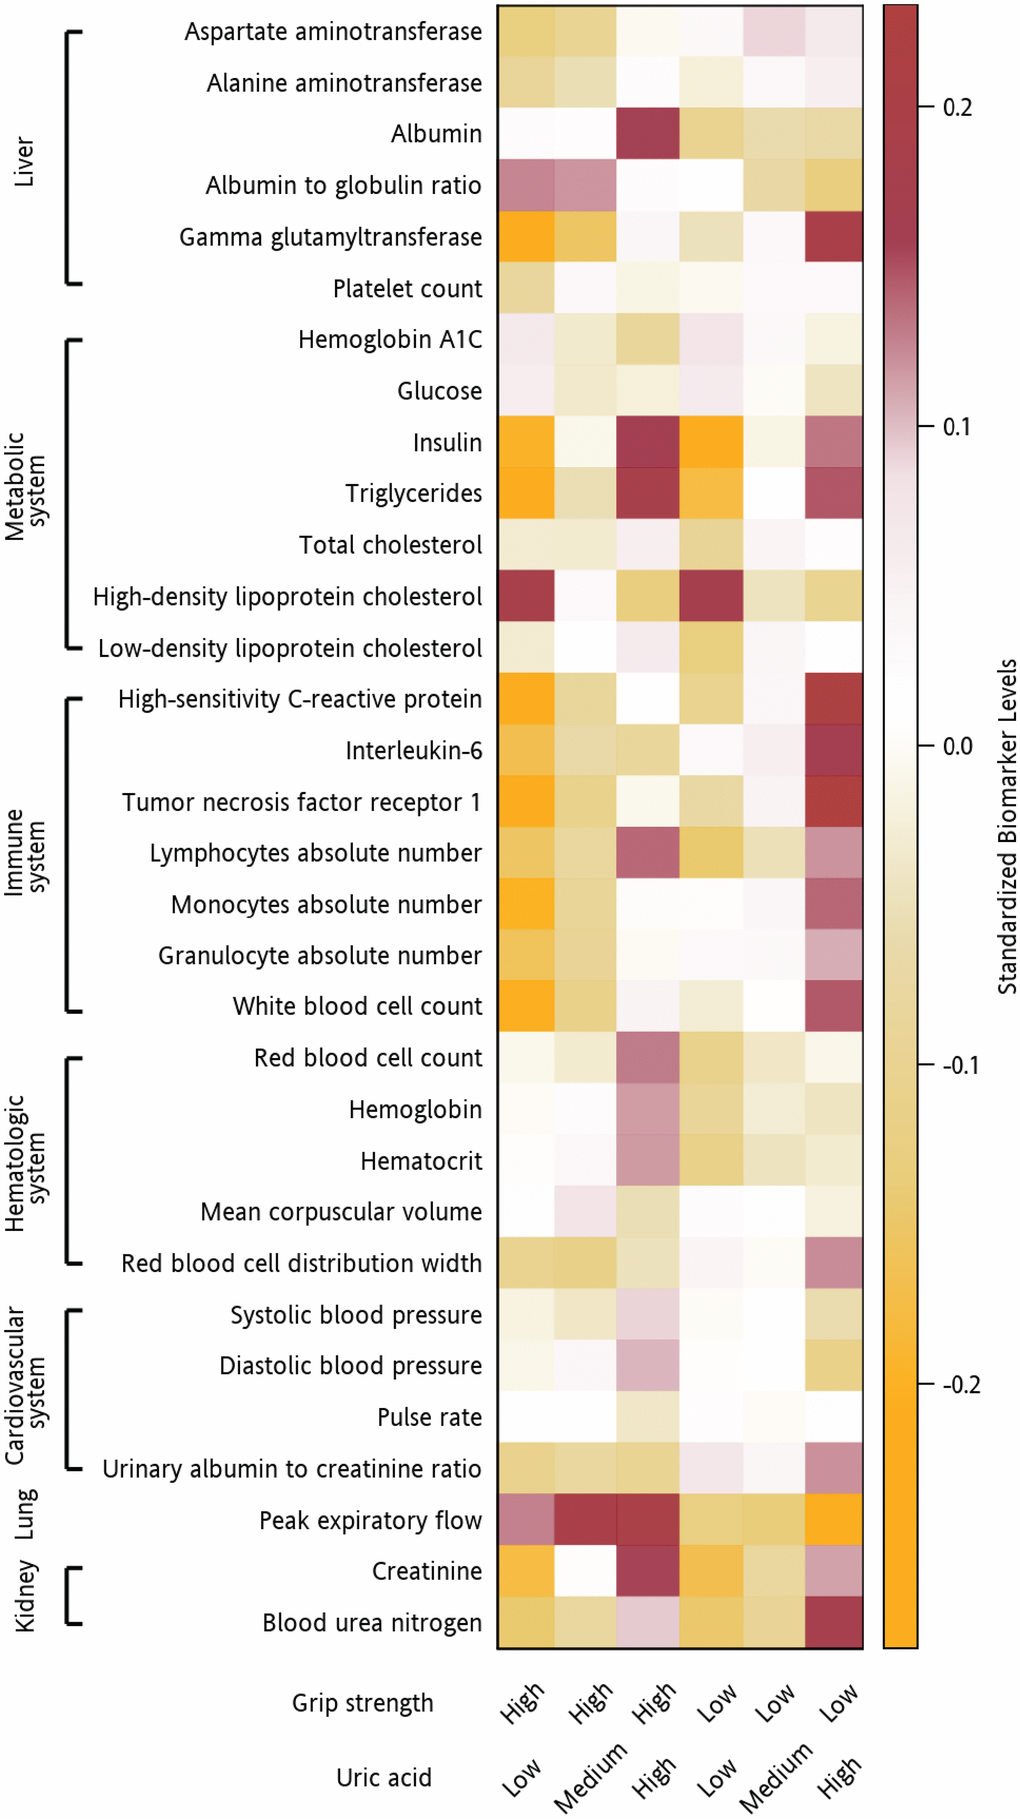
Figure 3.Clinical indicators of biological aging in participants with different serum uric acid levels and grip strengths. Heatmap of the adjusted mean levels of clinical indicators of biological aging organized by the physiological system (liver, metabolic system, cardiovascular system, lungs, kidneys, immune system, and hematologic system) in participants with different combinations of serum uric acid levels and grip strengths. The original data were standardized (non-normally distributed data were normalized first). A value of 1 indicates that the mean value for the group was one standard deviation higher than the mean value for the entire cohort. The values are represented by different colors. Brown indicates a higher mean biomarker value for that group than the mean for the entire cohort, whereas orange indicates a lower mean biomarker value for that group than the mean for the entire cohort.