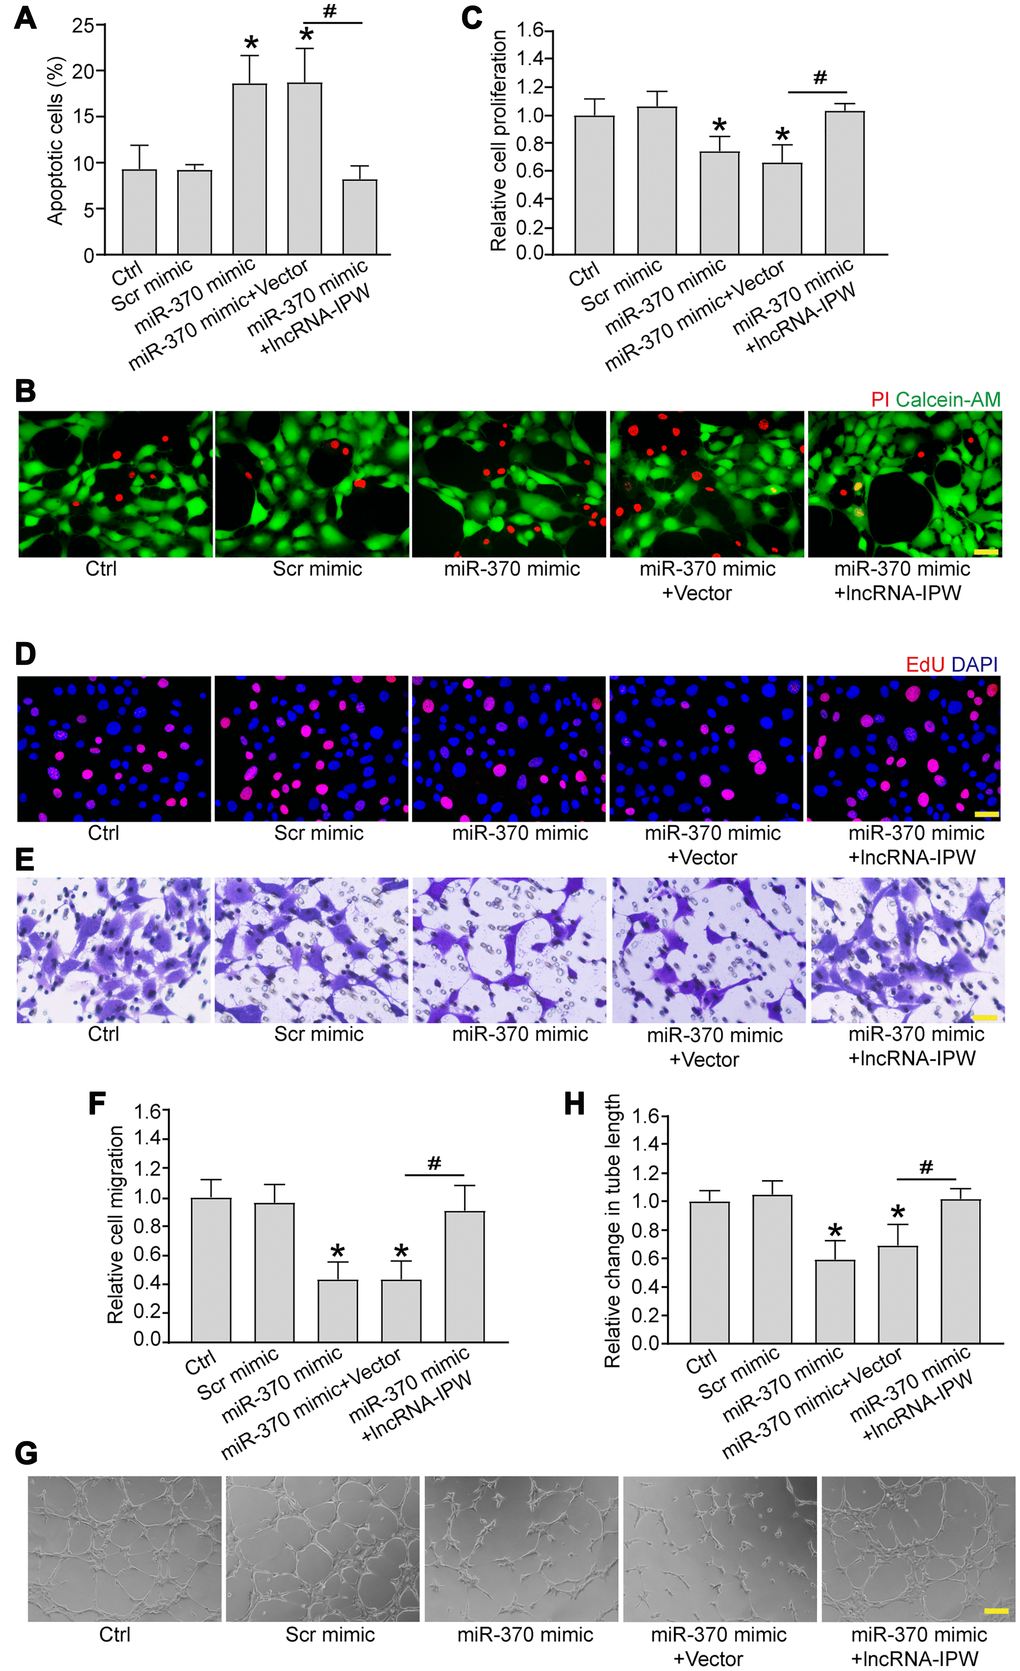
Figure 6.LncRNA-IPW/miR-370 interaction regulates endothelial angiogenic function in vitro. (A and B) RF/6A cells were transfected with scrambled (Scr) mimic, miR-370 mimic, miR-370 mimic plus pcDNA3.0 vector (Vector), miR-370 mimic plus pcDNA3.0-IPW, or left untreated (Ctrl) for 24 h, and then exposed with CoCl2 (200 μmol/L) to mimic hypoxic stress for 24 h. Apoptotic cells were determined by PI/Calcein-AM staining and quantified. Green: live cells; red: dead or dying cells. Scale bar: 50 μm (n = 4; *P < 0.05 versus Ctrl group; #P < 0.05 miR-370+IPW versus miR-370+vector; One-way ANOVA). (C–H) RF/6A cells were transfected with Scr mimic, miR-370 mimic, miR-370 mimic plus pcDNA3.0 vector, miR-370 mimic plus pcDNA3.0-IPW, or left untreated (Ctrl) for 24 h. Cell proliferation was detected by EdU staining and quantified. DAPI, blue; EdU, red. Scale bar: 20 μm (C and D; n = 4; *P < 0.05 versus Ctrl group; #P < 0.05 miR-370 + IPW versus miR-370+vector; One-way ANOVA). The migration of RF/6A cells was detected using Transwell assay and quantified. Scale bar: 100 μm (E and F; n = 4; *P < 0.05 versus Ctrl group; #P < 0.05 miR-370 + IPW versus miR-370 + vector; One-way ANOVA). The tube-like structures were observed at 6 h after cell seeding on the matrix. The average length of tube formation for each field was statistically analyzed. Scale bar: 200 μm (G and H; n = 4; *P < 0.05 versus Ctrl group; #P < 0.05 miR-370 + IPW versus miR-370 + vector; One-way ANOVA).