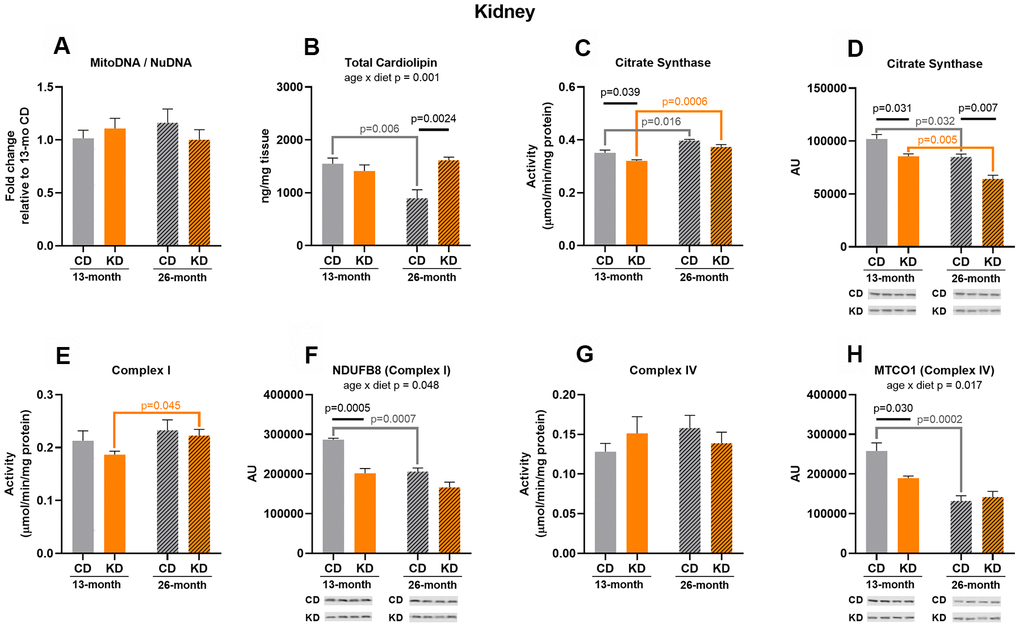
Figure 4.Markers of mitochondrial content in kidney of male mice after 1 month (13 months of age) and 14 months (26 months of age) on diet (n=4-6). (A) Mitochondrial to nuclear DNA ratio. Quantification of (B) total cardiolipin. Enzymatic activities for (C) citrate synthase, (E) Complex I, and (G) Complex IV. Quantification of (D) citrate synthase, (F) NDUFB8, and (H) MTCO1 protein levels by western blots. Diets: CD = control, KD= Ketogenic. Ages: solid bar = 13 months, dashed bar = 26 months. Values are expressed as mean ± SEM. 2-way ANOVAs followed by Bonferroni post hoc tests.