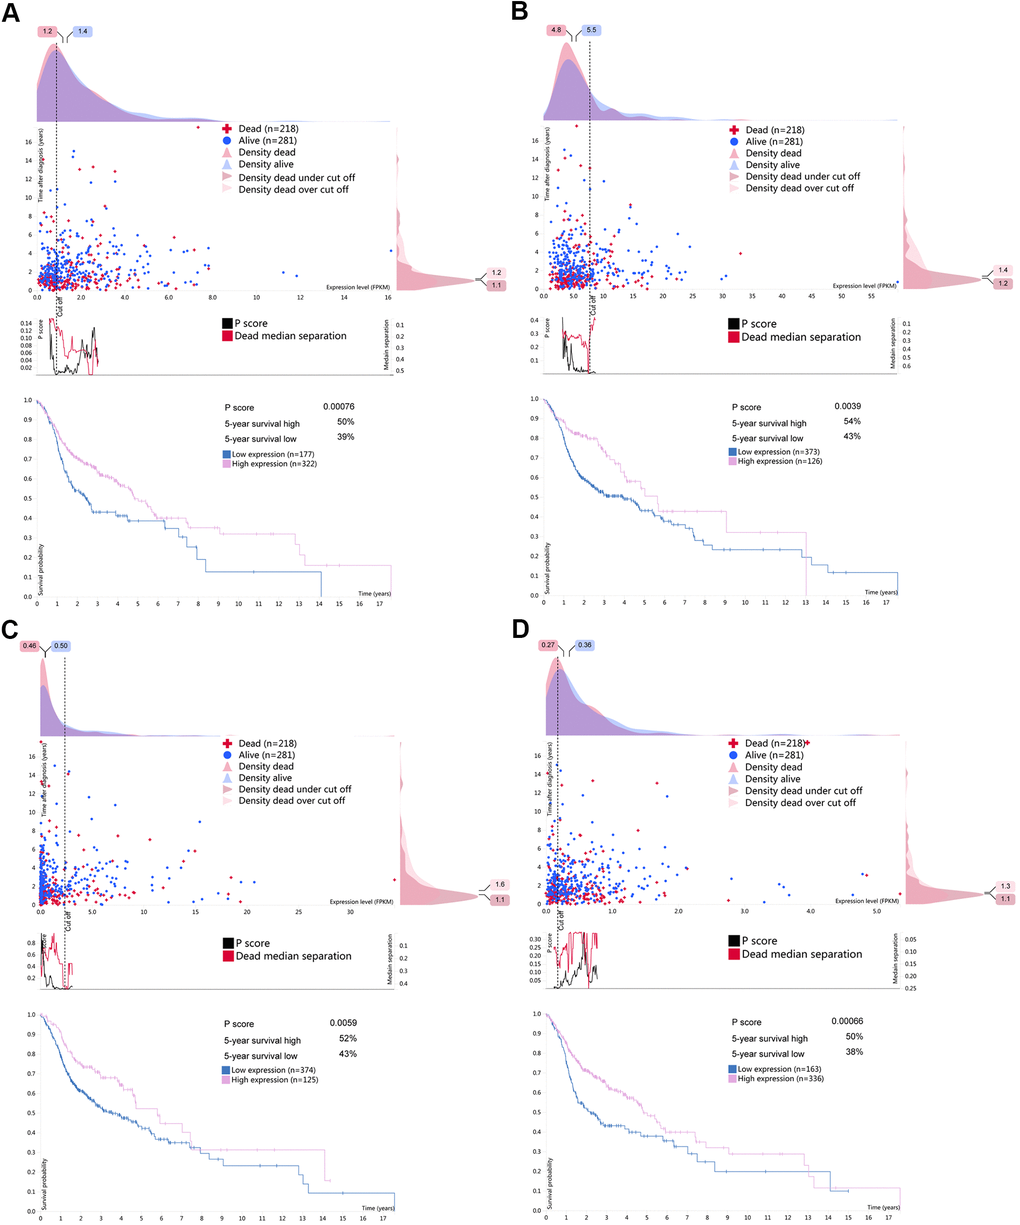
Figure 9.Survival associated RBPs expression in the human protein atlas database (HPA). Kaplan-Meier curves of survival associated (A) CELF2, (B) EZH2, (C) RNASE10 and (D) SIDT1 for HNSCC patients. Pink line indicates high expression group while blue line indicates low expression group.