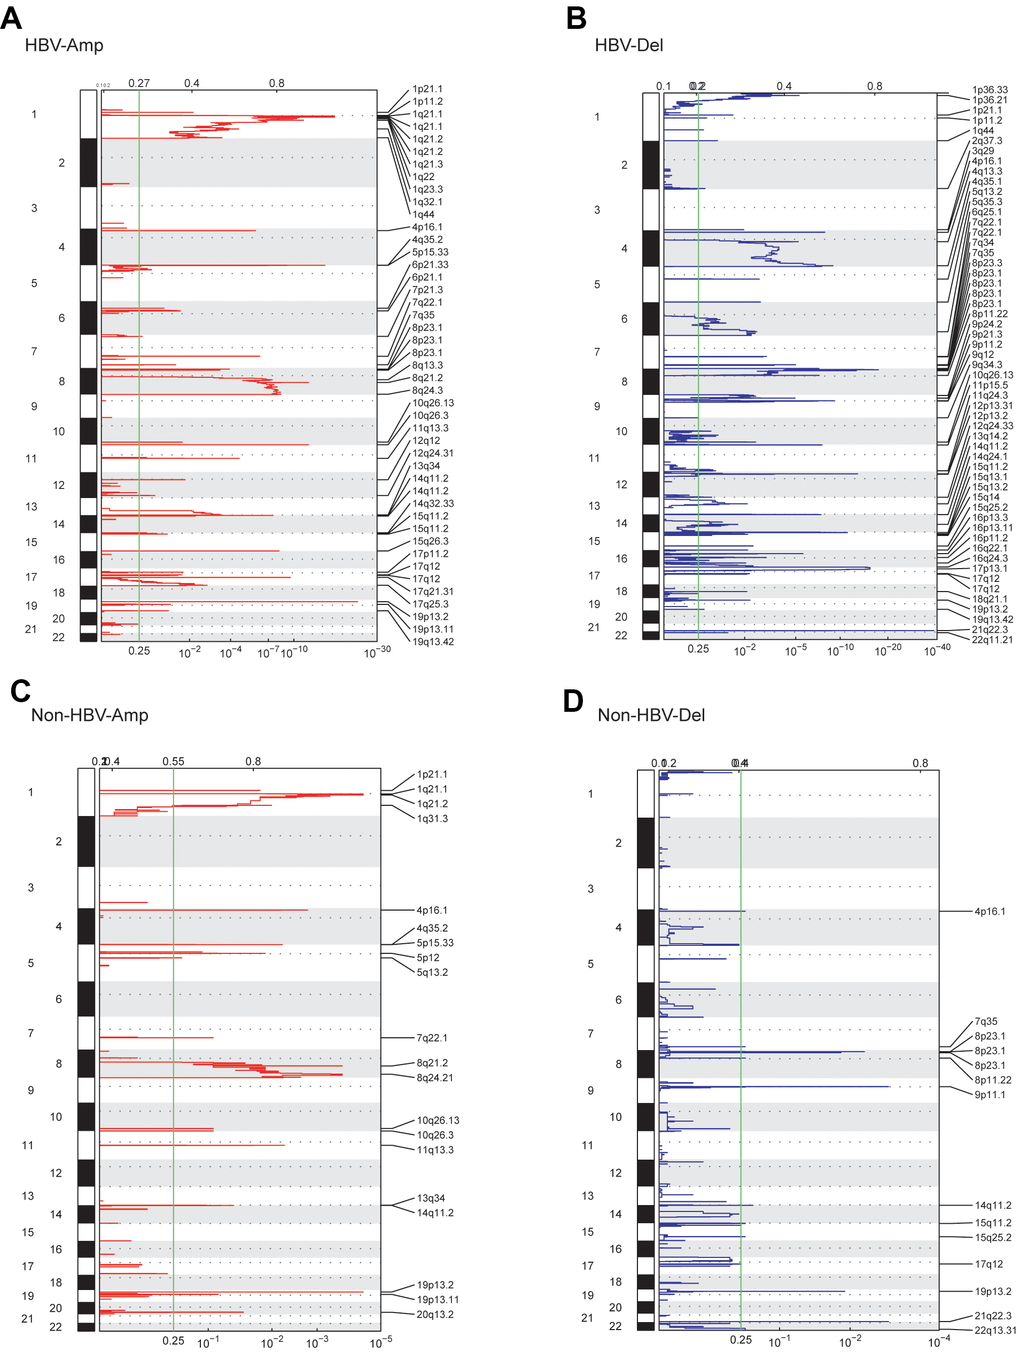
Figure 1.GISTIC analysis showed the whole-genome distribution of copy number alterations. (A) CNV amplifications in the WCH-HBV-HCC group. (B) CNV deletions in the WCH-HBV-HCC group. (C) CNV amplifications in the WCH-NonHBV-HCC group. (D) CNV deletions in the WCH-NonHBV-HCC group. GISTIC q-values (x-axis) for deletions (B, D) and amplifications (A, C) are plotted across the genome (y-axis). The green vertical line is where the q-value is 0.25.