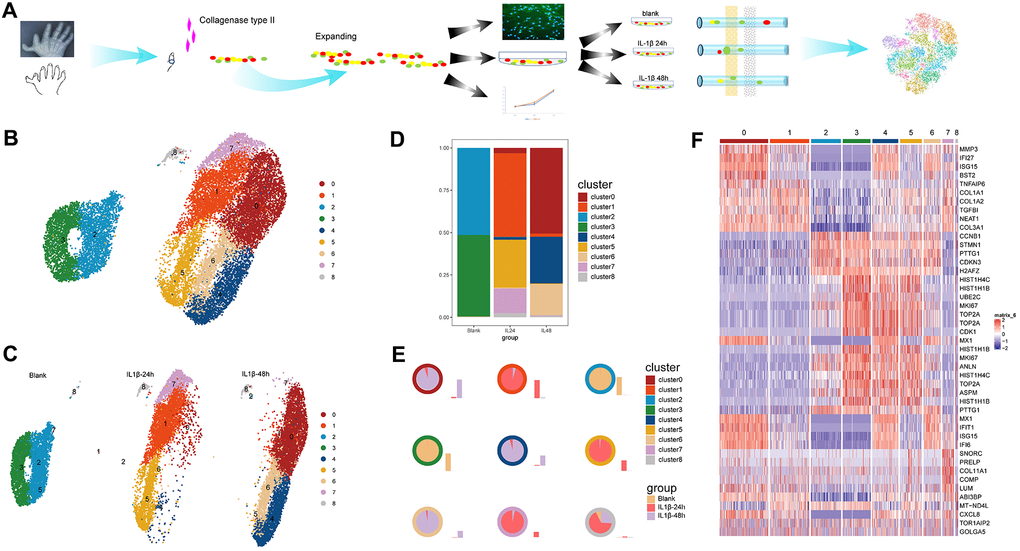
Figure 1.Work flow and identification of cell clusters. (A) A schematic of the process of species access and data collection. (B) The u-map analysis of the integrated data resulted in the identification of nine distinct cell clusters. (C) The distributions of the cell clusters on each sample; different colors represent different cell clusters and each plot indicates one cell. (D) The stacked chart of the proportions of the distinct cell clusters in the three samples. (E) The distribution ratio and quantity in samples of each cell cluster. The colors of the outer circle of each pie chart represent cell clusters. Each pie chart illustrates the ratio of one certain cluster in three samples and the accompanying histogram shows the quantity change of one certain cluster in three samples. (F) The graphical heatmap of the top 5 differentially expressed genes for each cell cluster.