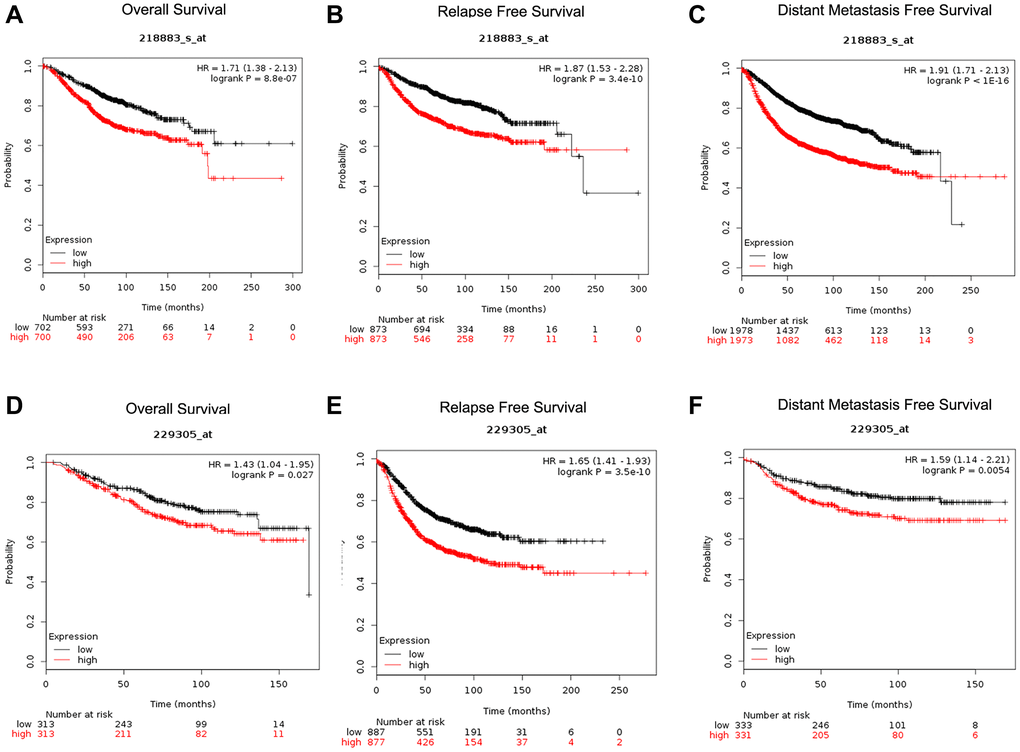
Figure 3.Determination of prognostic significance of CENPU expression (Affymetrix IDs are valid: 218883_s_at and 229305_at) in patients with breast cancer from Kaplan-Meier plotter database. (A, D) OS curves established according to CENPU expression. (B, E) RFS curves established according to CENPU expression. (C, F) DMFS curves established according to CENPU expression.