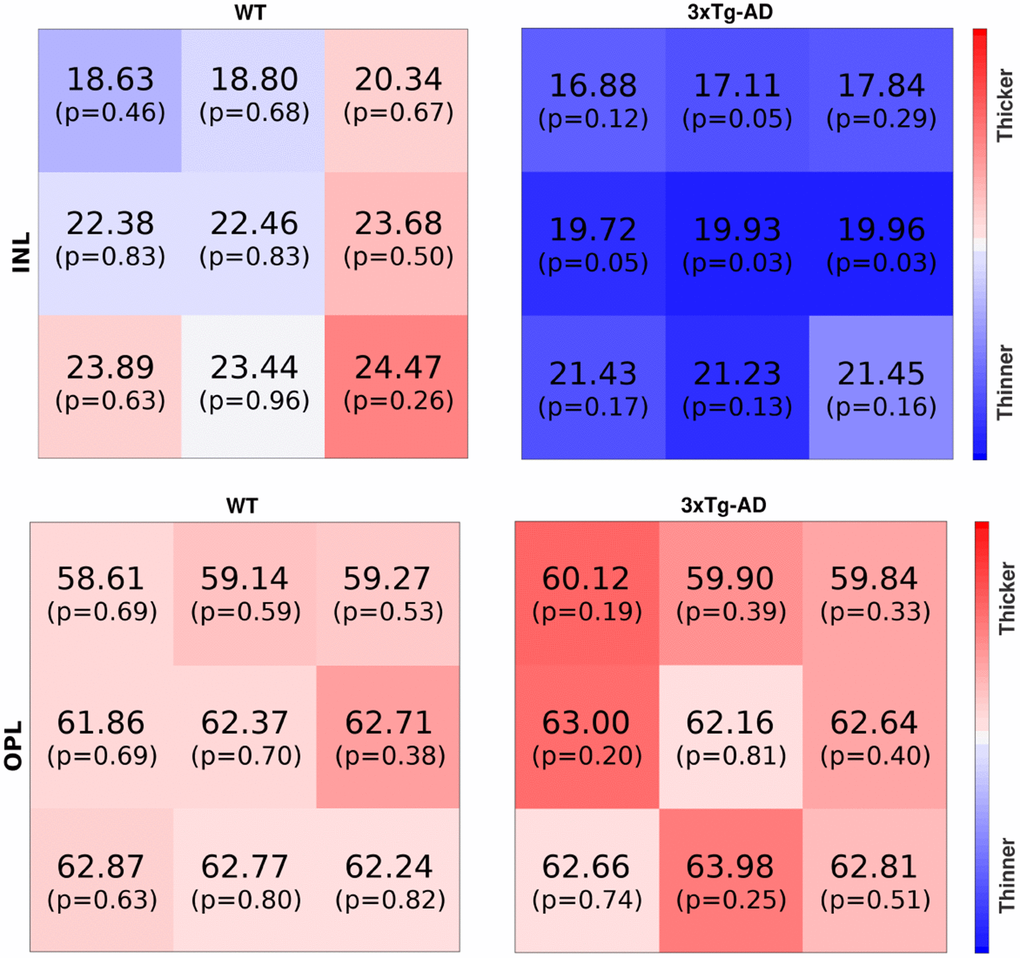
Figure 5.The first row shows inner nuclear layer thickness maps for one WT (mouse E038, two-months-old, right eye) and one 3×Tg-AD (mouse E032, two-months-old, left eye), respectively the left and right maps. The second row shows thickness maps from the outer nuclear layer for the same mouse. The thickness (μm) and p-value are shown per block. Blue/red colors denote thickness below/above the average. Color intensity increases with the increase in the probability of thickness being abnormal.