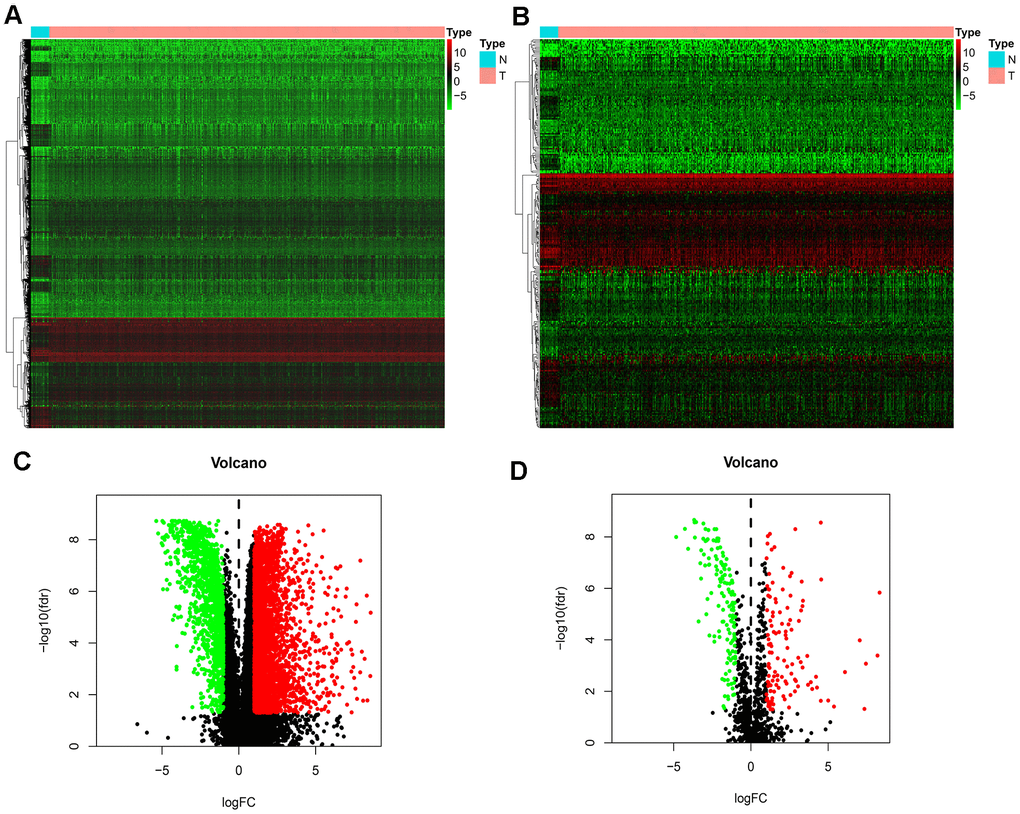
Figure 1.Differentially expressed IRGs. (A) Heatmap demonstrating DEGs between BLCA and normal samples, with red representing high expression and green representing low expression. (B) Heatmap demonstrating differentially expressed IRGs between BLCA and normal samples, with red representing high expression and green representing low expression. (C) Volcano plot of 4893 DEGs, with red representing up-regulated DEGs and green representing down-regulated DEGs. (D) volcano plot of 261 differentially expressed IRGs, with red representing up-regulated IRGs and green representing down-regulated IRGs.