Submit an Article
Navigate
Home
Editorial Board
Editorial Policies
Current Volume
Archive
Scientific Integrity
Publication Ethics Statements
Interviews with Outstanding Authors
Newsroom
Sponsored Conferences
Podcast
Contact
Special Collections
Submit an Article
Online ISSN: 1945-4589
Research Paper
|
Volume 13, Issue 8
|
pp. 12099–12112
Development of a prognostic index and screening of prognosis related genes based on an immunogenomic landscape analysis of bladder cancer
Back to article
Figure 2
(2 of 8)
−
100%
+
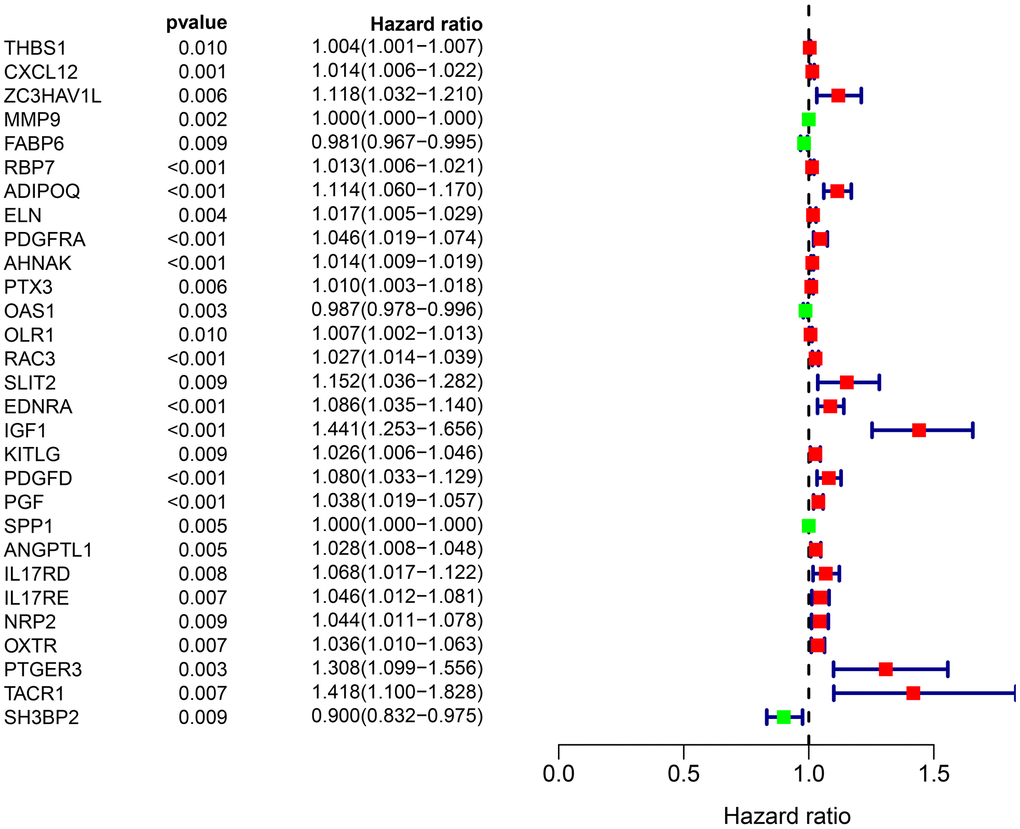
Figure 2.
Forest plot of the hazard ratios showing the prognostic values of survival-associated IRGs, red dots represent high-risk genes (HR > 1), and green dots represent low-risk genes (HR < 1).