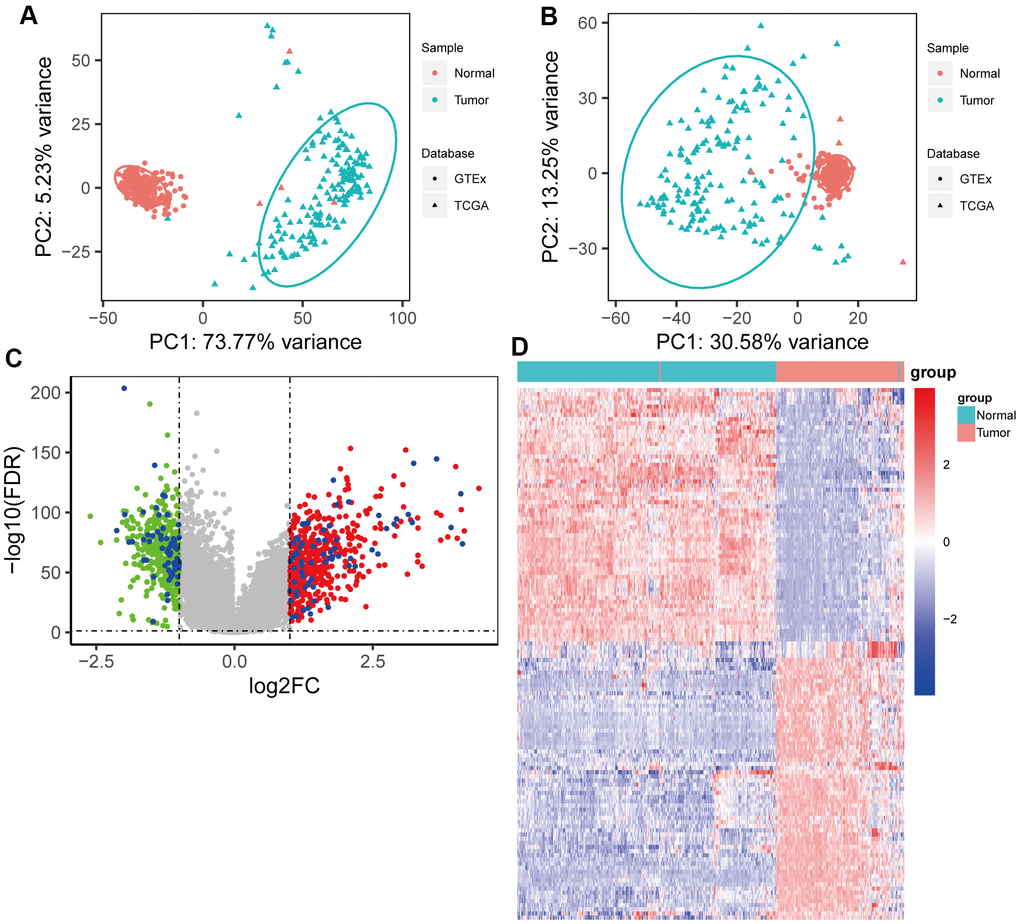
Figure 2.Identification of resistance-related differentially expressed genes (RRDEGs) in pancreatic cancer. (A) Principle component analysis (PCA) plot of the data merged from The Cancer Genome Atlas (TCGA) and Genotype-Tissue Expression (GTEx) datasets before removing the batch effect. (B) PCA plot of the data merged from TCGA and GTEx datasets after removing the batch effect. (C) Volcano plot of DEGs between tumor tissues and normal tissues. The red and green points are DEGs, and RRDEGs are plotted with blue points. The lines were drawn where the absolute value of log2FC is equal to 1 and FDR is equal to 0.05. (D) Heatmap showing the expression of RRDEGs.