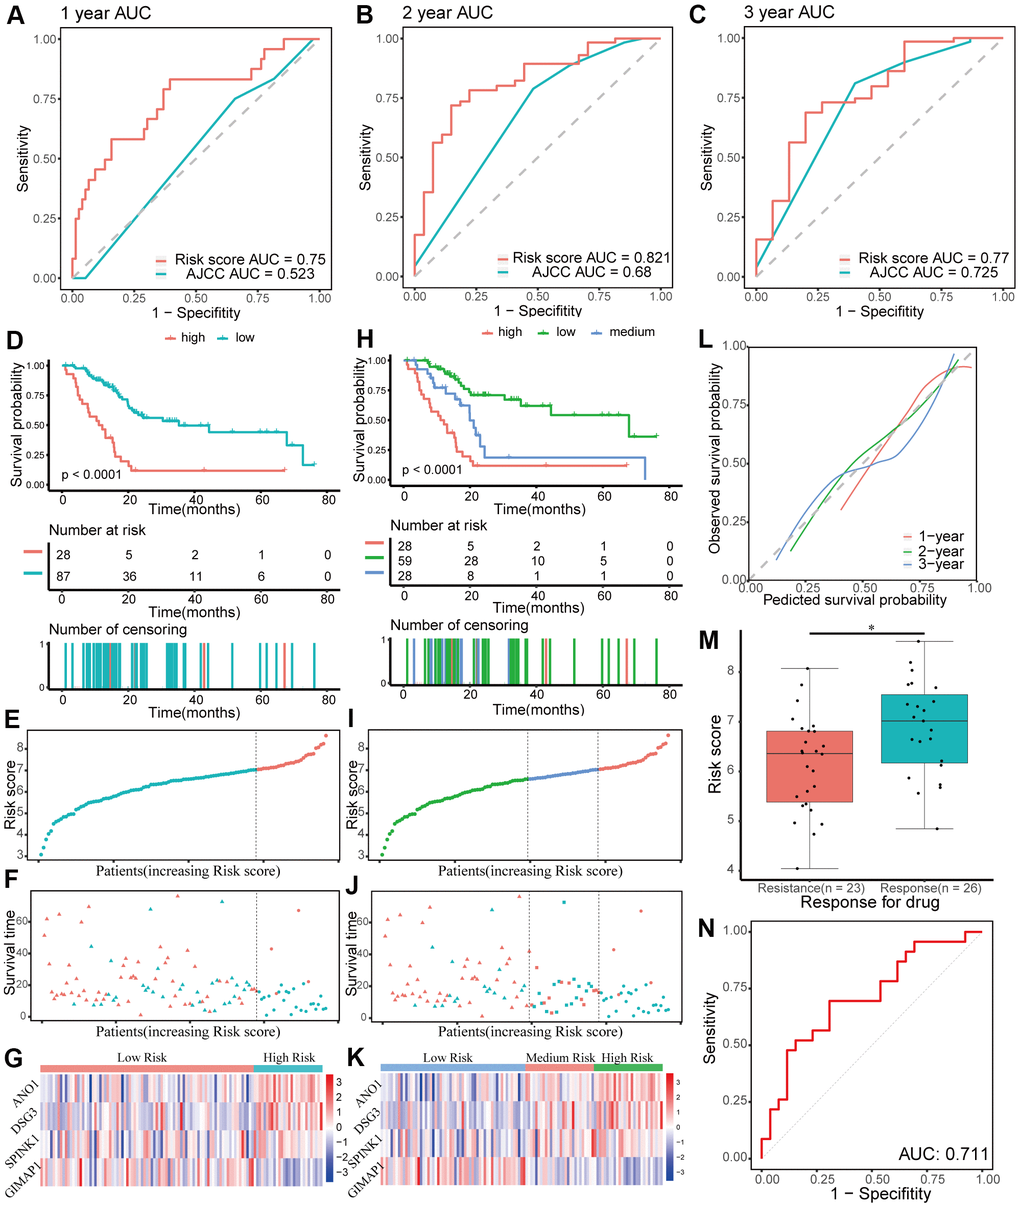
Figure 5.Evaluating the performance of the prognostic gene signature in the training group. (A–C) Time-dependent receiver operating characteristic (ROC) curves for 1-, 2-, and 3-year overall survival predictions of the gene signature. American Joint Committee on Cancer (AJCC) stage is the control. (D–G) Kaplan-Meier survival curves of the four-gene signature and distribution of patient survival and risk score in different groups when patients are divided into two groups. (D) Kaplan-Meier survival curves. (E) Distribution of risk score. (F) Distribution of survival time. Circle shape stands for high-risk group while triangle shape for low-risk group. Red stands for survival and green stands for dead. (G) Heatmap of the expression of the four genes. (H–K) Kaplan-Meier survival curves of the four-gene signature and distribution of patient survival and risk score in different groups when patients are divided into three groups. (H) Kaplan-Meier survival curves. (I) Distribution of risk score. (J) Distribution of survival time. (K) Heatmap of the expression of the four genes. (L) Calibration plot for validation of the gene signature. (M) Distribution of risk score in different responses to drug in the training group. (N) The ROC curve for the response to drug prediction of risk score in the training group is shown.