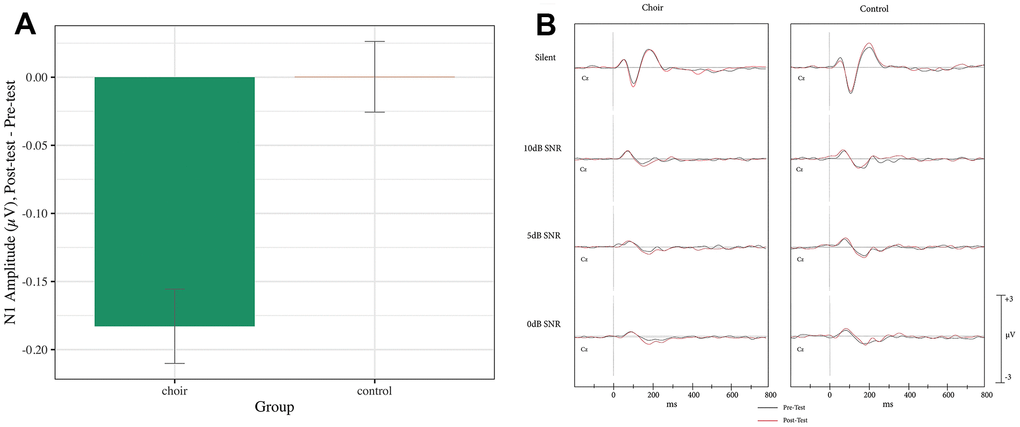
Figure 2.(A) N1 amplitude, difference score (post-test – pre-test) averaged across frontal and central in the passive condition of the syllable-in-noise task in choir and control groups. (B) ERPs recorded at Cz during passive condition of the syllable-in-noise task in the choir and control groups at pre and post-test for each noise condition.