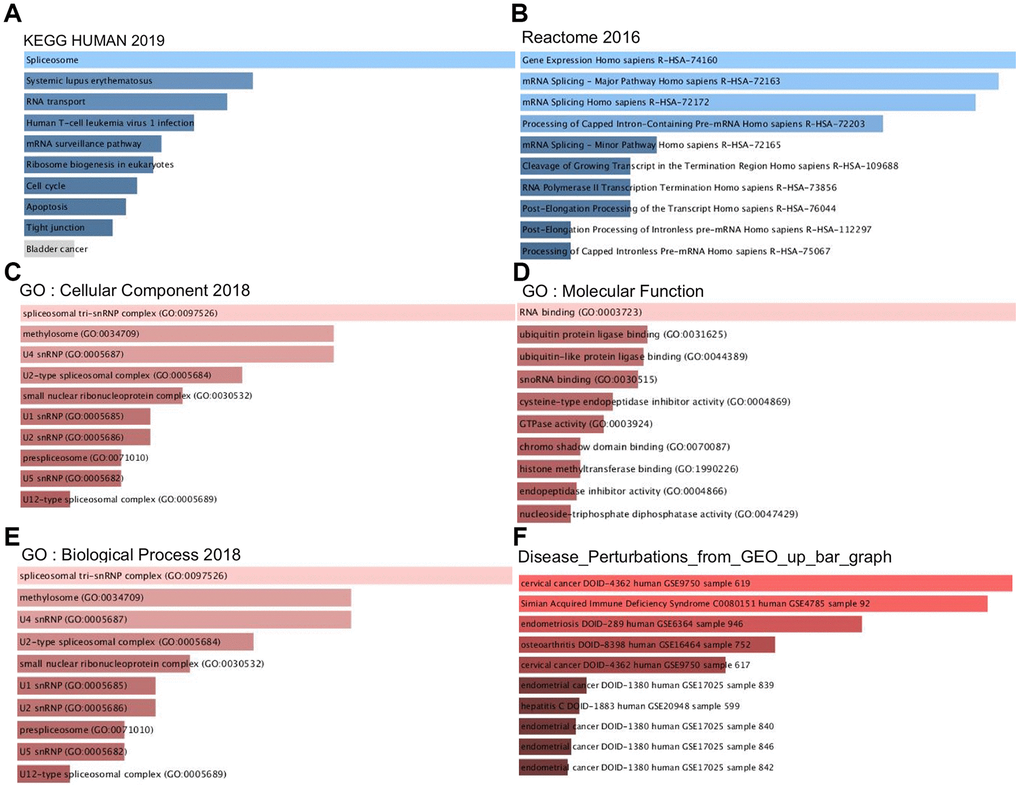
Figure 8.Signaling pathways of PPM1G coexpressed genes (Enrichr). These figures show the gene ontology (GO) and signaling pathways of PPM1G in LIHC. (A) KEGG pathways (2019). (B) REACTOME pathways (2016). (C) GO cellular component (CC) (2018) terms. (D) GO molecular function (MF) (2018) terms. (E) GO biological process (BP) (2018) terms. (F) Bar graph showing the “Disease perturbations from GEO up ” gene set. The bar graph represents the ratio of the percent composition of terms in proteomic data to percent composition in the genome annotation. The length of the bar represents the significance of that specific gene set or term. The brighter the color is, the more significant the term.