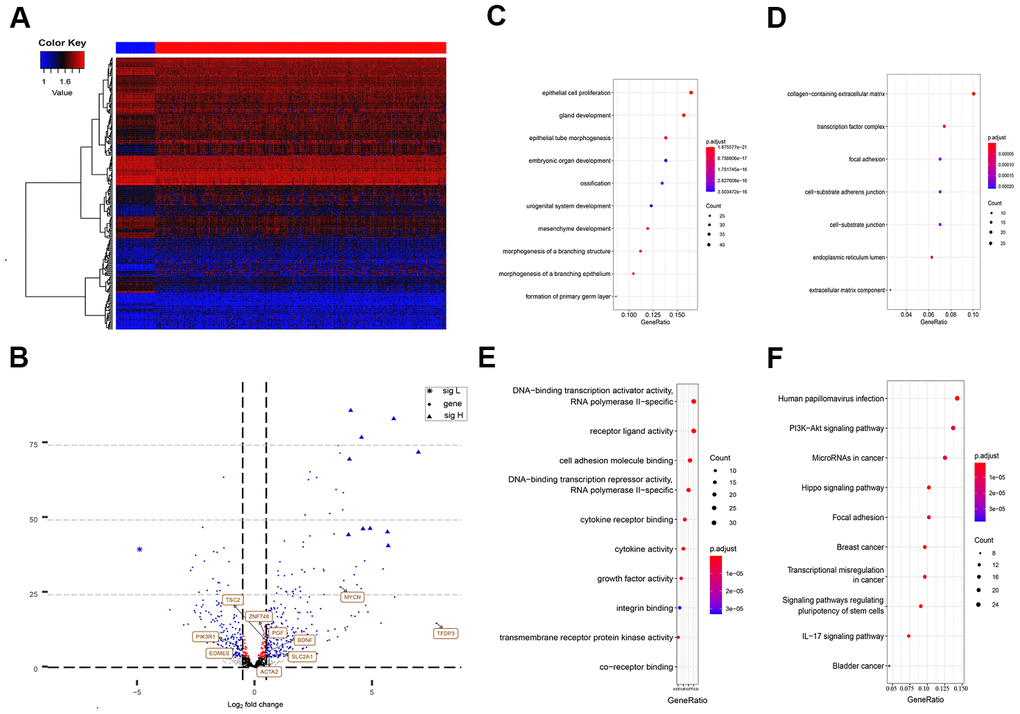
Figure 1.Differently expressed EMT related genes between normal and HCC tissues. (A) Heatmap of 270 differently expressed EMT related genes in TCGA-LIHC. The color from blue to red represents low expression to high expression. (B) Volcano plot of EMT related genes: blue indicates down and upregulated genes. Changes of the risk genes are identified by names. (C–E) Dot plots represents biological process, cellular component and molecular function of Gene ontology analysis based on 270 HCC dysregulated EMT related genes respectively. (F) KEGG pathway analysis of differently expressed EMT related genes. EMT, Epithelial cell transformation; HCC, hepatocellular carcinoma; TCGA, The Cancer Genome Atlas; KEGG, Kyoto Encyclopedia of Genes and Genomes.