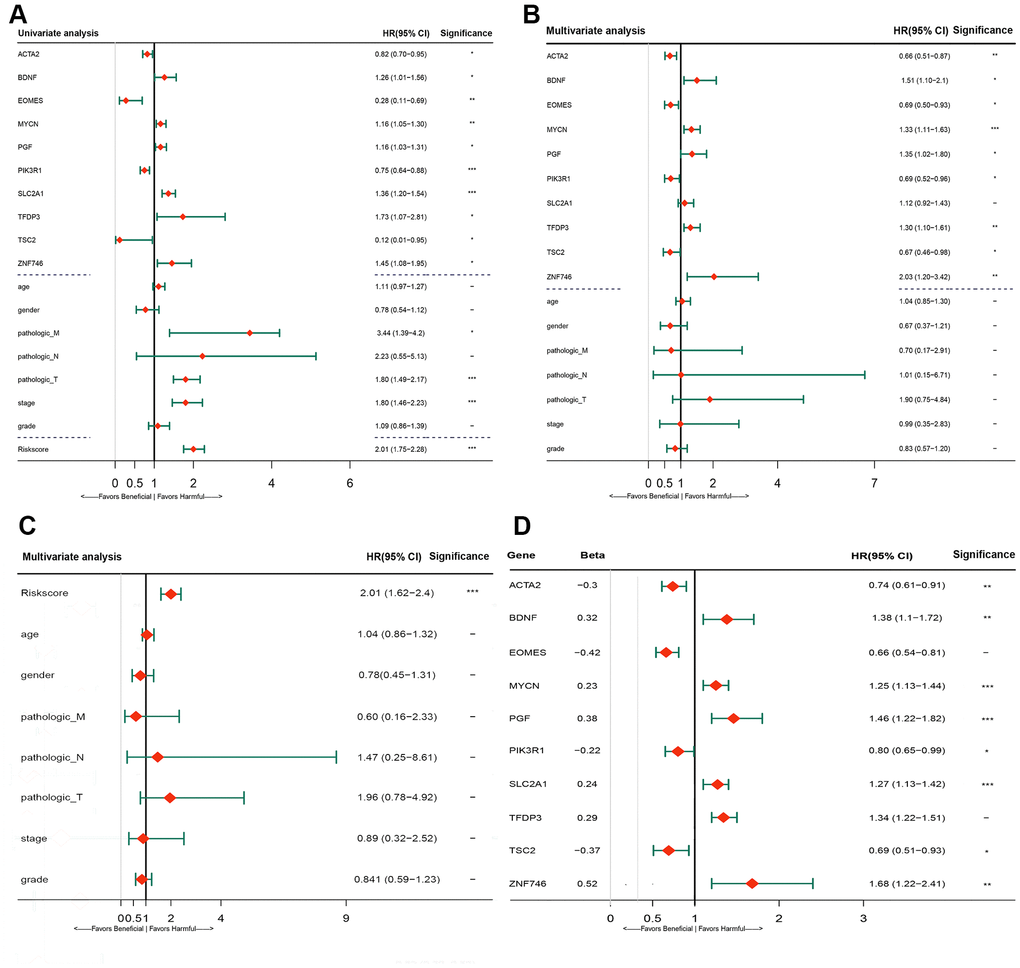
Figure 5.Forrest plot of the univariate and multivariate Cox regression analysis in TCGA cohorts. (A) Forrest plot of the univariate Cox regression analysis OS of 10 gene signature and clinical factor. (B) Forrest plot of the multivariate Cox regression analysis OS of 10 gene signature and clinical factor. (C) Forrest plot of the multivariate Cox regression analysis OS of risk score and clinical factor. (D) Forrest plot of the multivariate Cox regression analysis OS of 10 gene signature. Beta values representatives the coefficient index β for each gene. TCGA, The Cancer Genome Atlas; OS, overall survival.