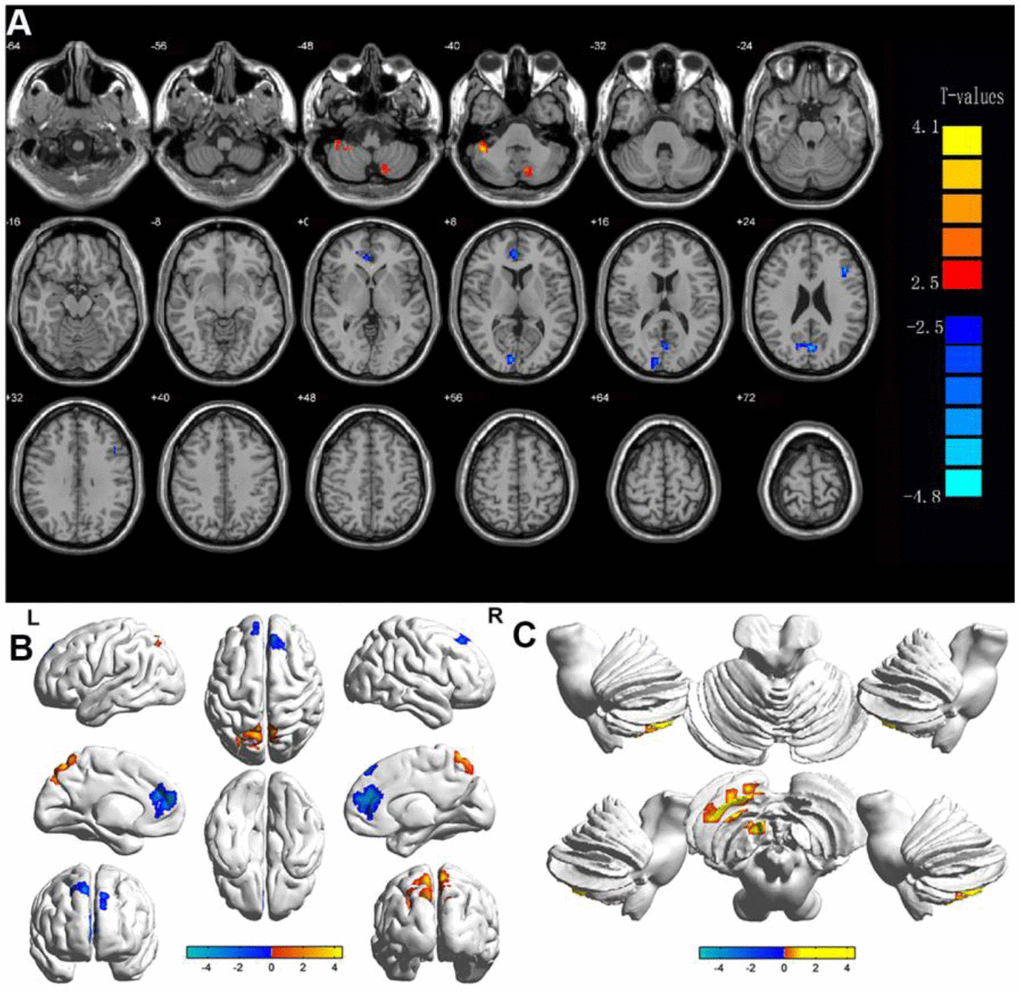
Figure 2.Display of DC values in different brain regions. Notes: Significant differences in DC were observed in (A, B) shows the changes in DC in the cerebral cortex, and (C) shows the changes in DC in the cerebellum. The yellow regions indicate higher DC values.