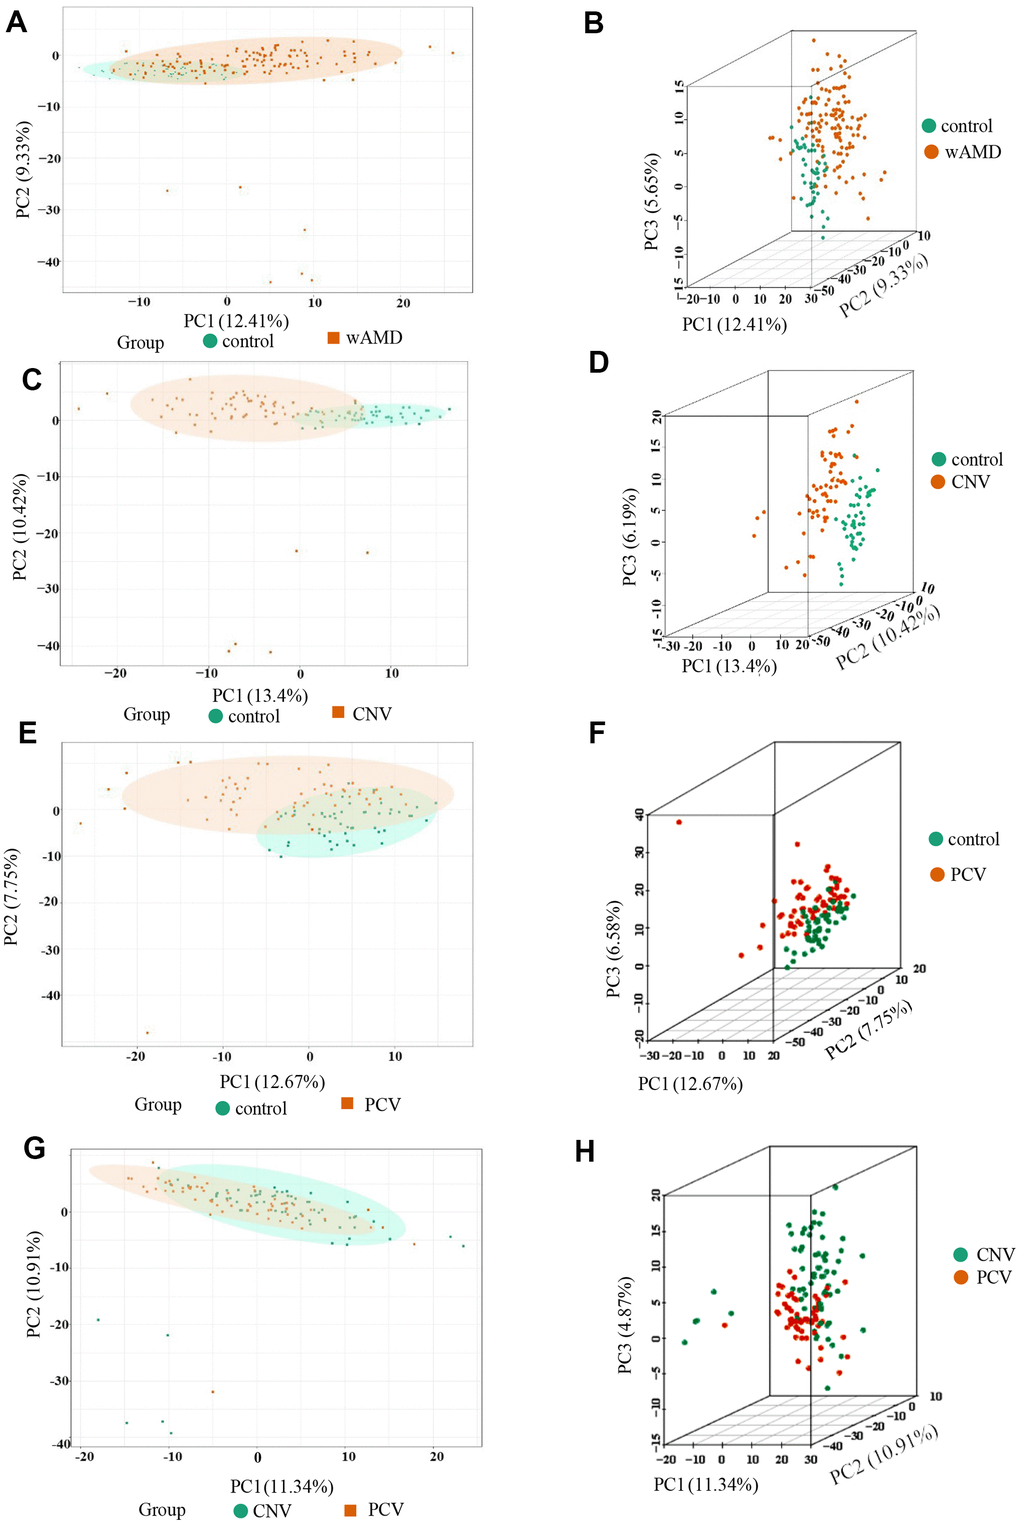
Figure 1.PCA result of the wAMD group, PCV group, and CNV group. (A, C, E, G) are the two-dimensional images of the PCA results of each group. (B, D, F, H) are the 3D images of the PCA results of each group. The X-axis represents the first principal component, the Y-axis represents the second, and the Z-axis represents the third. wAMD: represents the mixture of the CNV group and PCV group.