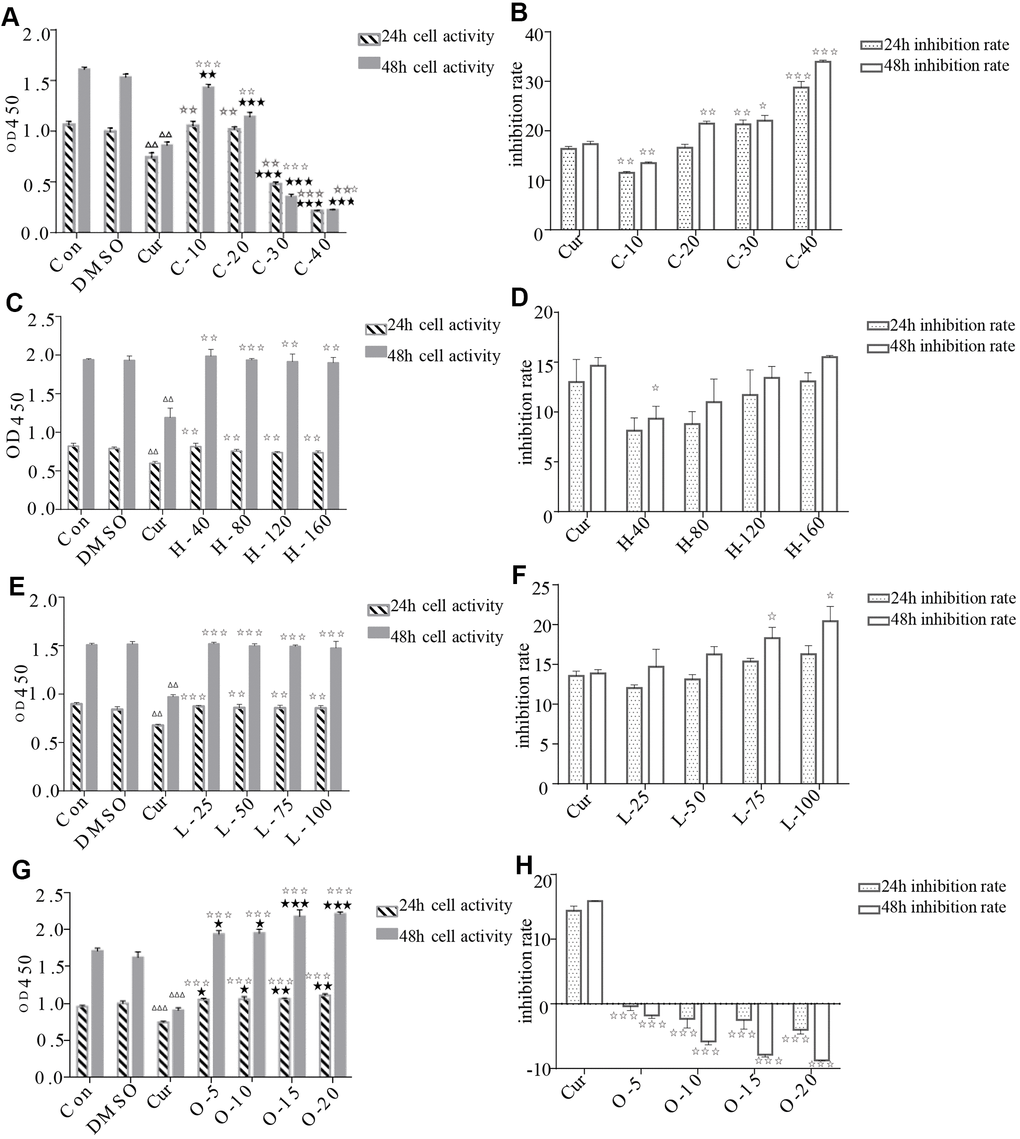
Figure 8.Effects of cyclamic acid, hyodeoxycholic acid, L-tryptophanamide, and O-phosphorylethanolamine on the activity and proliferation of HRPECs. (A, C, E, G) respectively reflected the changes of cell activity after hRPE cells were treated with cyclamic acid, hyodeoxycholic acid, L-tryptophanamide, and O-phosphorylethanolamine. (B, D, F, H) respectively reflected the changes of cell proliferation inhibition rate after treatment. C-10, C-20, C-30 and C-40 represent 10 μmol/ml, 20 μmol/ml, 30 μmol/ml and 40 μmol/ml cyclamic acid, respectively. H-40, H-80, H-120 and H-160 represent 40 μM, 80 μM, 120 μM, 160 μM hyodeoxycholic acid, respectively. L-25, L-50, L-75 and L-100 represent 25 μM, 50 μM, 75 μM and 100 μM L-tryptophanamide. O-5, O-10, O-15 and O-20 represent 5 μmol/ml, 10 μmol/ml, 15 μmol/ml and 20 μmol/ml O-phosphorylethanolamine. ΔΔ and ΔΔΔ indicated that the positive control group (cur) was significantly different from the 0.1% ✰ ✰ DMSO group (0.001