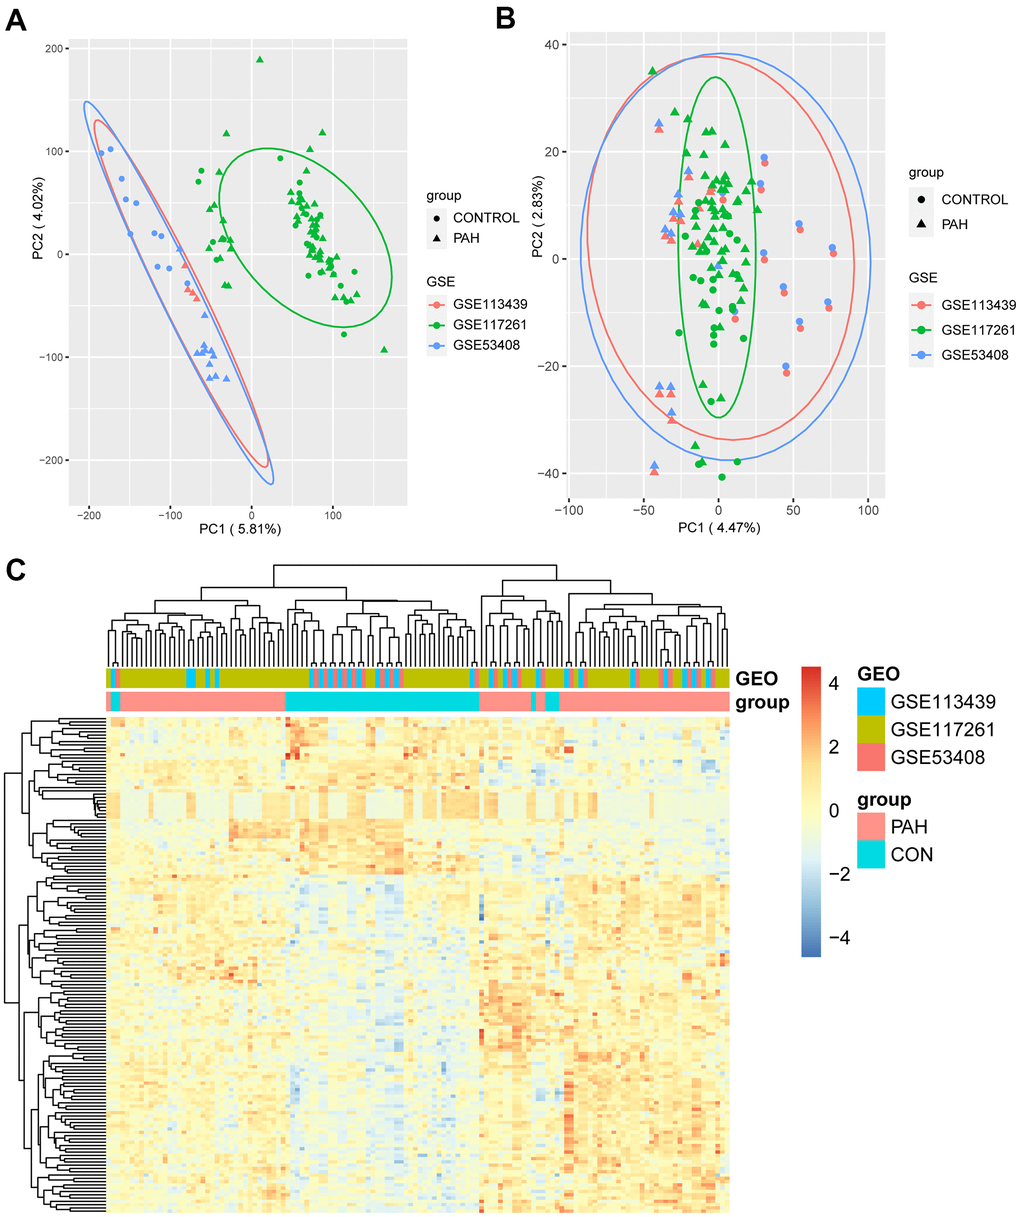
Figure 2.The result of DEGs identification. (A) Principal component analysis (PCA) before batch effects removement. (B) PCA after batch effects removement. (C) Heatmap of 151 DEGs screened by “Limma” package. In the differentiating gene sets (GSE113439, GSE117261 and GSE53408), samples were sorted by columns, and genes were sorted by rows. Cyan squares represented the control group, and red squares represented the PAH group. DEGs: differentially expression genes.