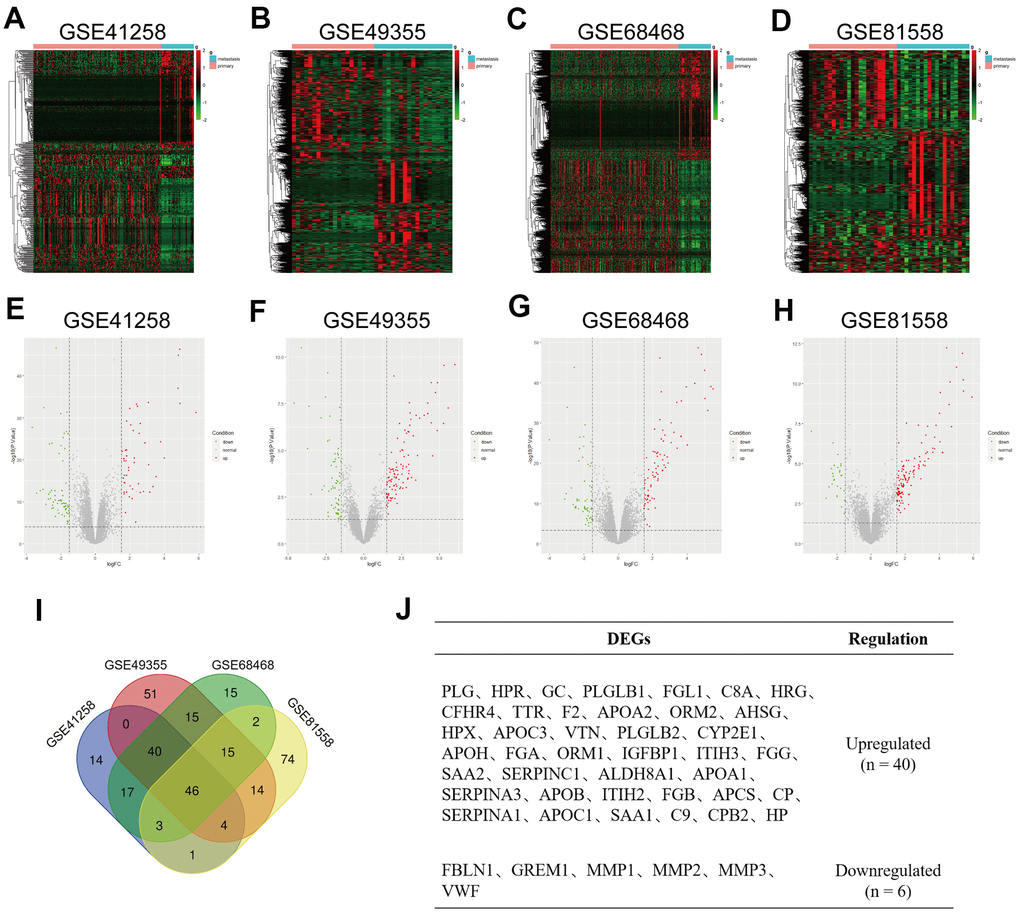
Figure 1.Identification of differentially expressed genes (DEGs) in colorectal liver metastases (CRLM). (A–D) Heatmap of top 500 variable of DEGs between CRC primary tumor tissues and CRC liver metastatic tumor tissues in GSE41258, GSE49355, GSE68468 and GSE81558 datasets. (E–H) Volcano plot of DEGs identified from GSE41258, GSE49355, GSE68468 and GSE81558 datasets. Green dots express downregulated DEGs, and Red dots represent upregulated DEGs under the same thresholds. The gray dots denote genes that are not differentially expressed. |log2FC| > 1.5 and P-value < 0.05 were set as the cut-off criteria. (I) The intersection of DEGs of GSE41258, GSE49355, GSE68468 and GSE81558 datasets. (J) List of consistent DEGs, including 40 upregulated DEGs and 6 downregulated DEGs.