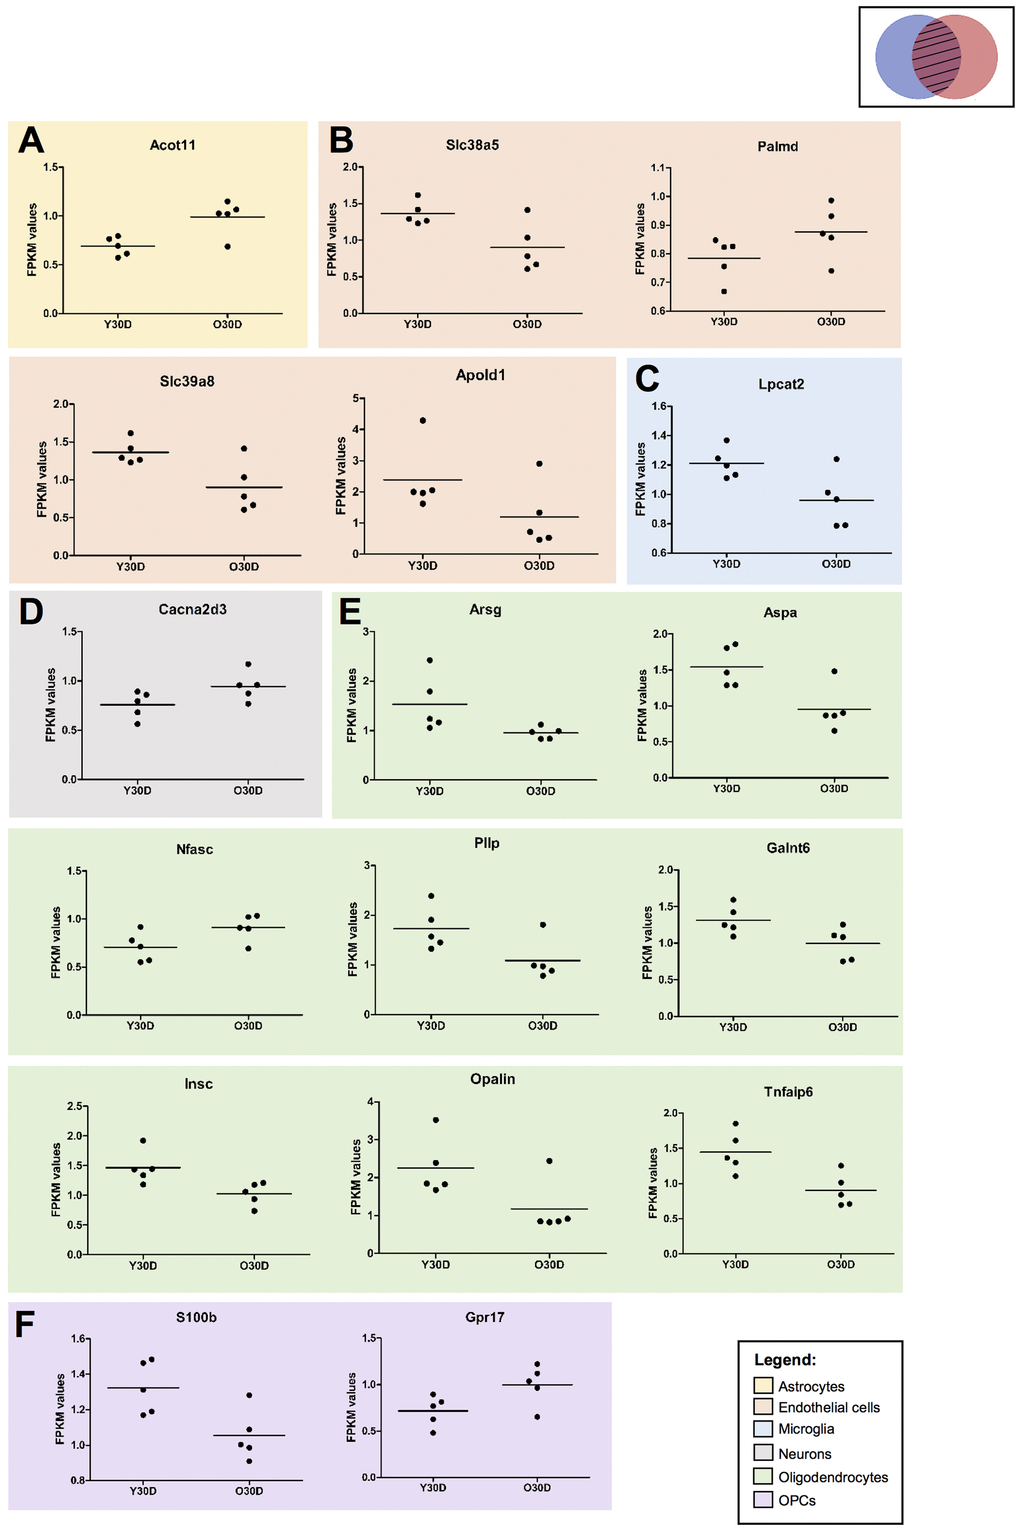
Figure 8.Expression of cell type specific genes overlapping between young 30-day BCAS and old Sham animals. (A) Astrocyte-associated gene (B) endothelial-associated genes (C) microglia-associated genes, (D) neuron-associated genes, (E) oligodendrocyte-associated genes, (F) OPC-associated genes. All gene expression values were normalised using the average of the respective controls (i.e. YSham for Y30D and OSham for O30D, respectively). Each dot corresponds to the biological replicates (n=5 for each group). The values are presented as FPKM values obtained through the RNA sequencing results. The solid horizontal lines represent the mean gene expression among the biological replicates.