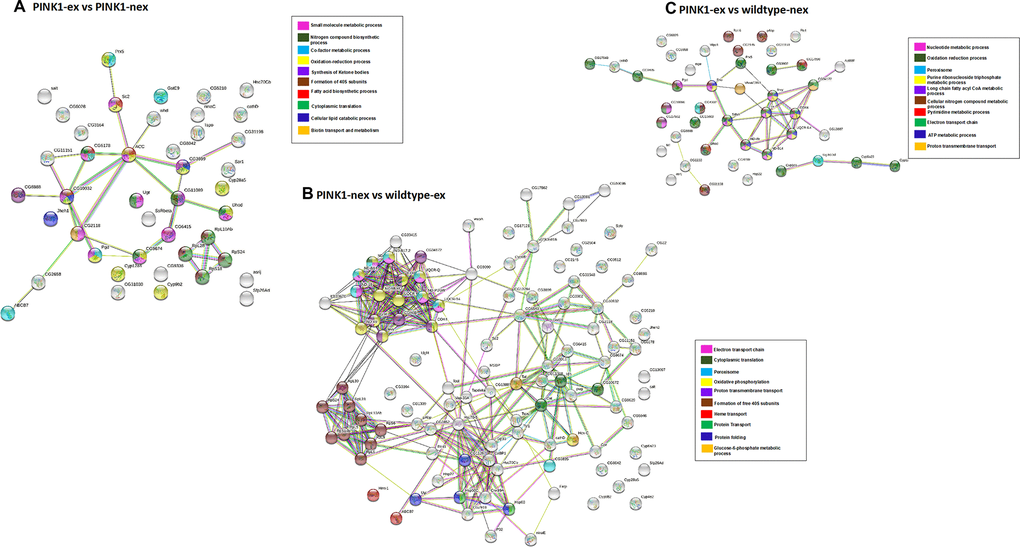
Figure 6.Network analysis of differentially expressed proteins. (A) Pink1- exercised vs Pink1- non-exercised; (B) Pink1- non-exercised vs wild type exercised; (C) Pink1- exercised vs wild type non-exercised. Networks analysed using STRINGdb. The nodes are coloured according to the processes (legend) that the proteins are involved in by using GO Terms for Biological Processes. The edge shows type of interactions, experimentally determined interactions are pink and the one obtained from databases are sky blue. Predicted interactions such as gene neighbourhood are blue, green and red for gene co-occurrence, gene neighbourhood and gene fusions. Co-expression interactions are shown in black, text-mining interactions are shown in light green and protein homology edges are purple.