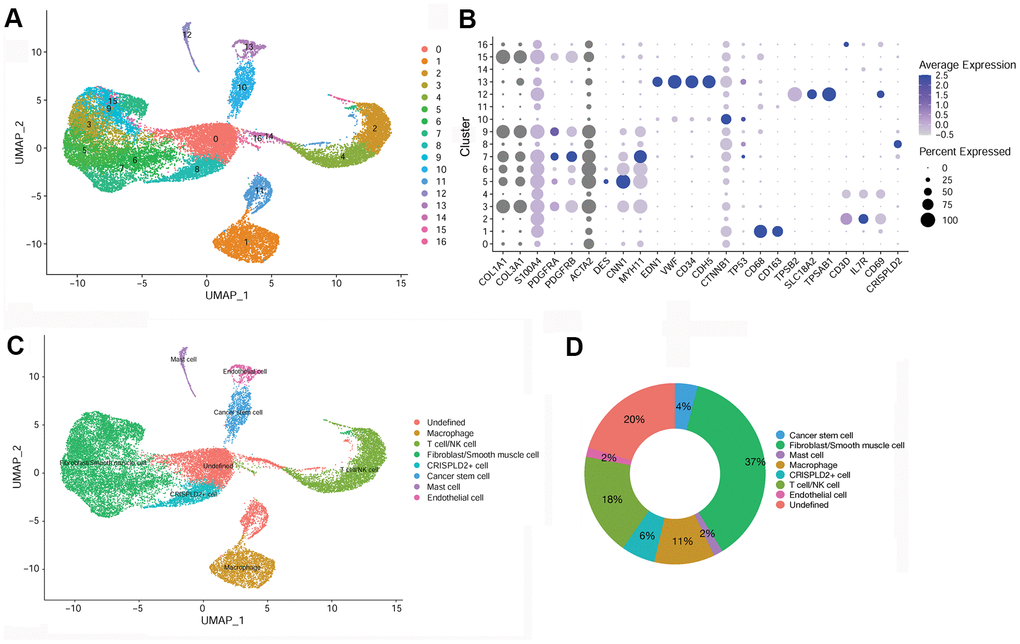
Figure 2.Identification of key marker genes and overall characteristics of cell cluster compositions in pulmonary endarterectomized tissues of CTEPH patients. (A) UMAP plot of 17 clusters. (B) Bubble diagram showing the key marker genes in 17 clusters. (C) UMAP plot of eight cell types. Based on cell markers, clusters 3, 5, 6, 7, 9, and 15 were annotated as fibroblasts/smooth muscle cells. Clusters 2 and 4 were classified as T-/NK cells. Clusters 1, 8, 10, 12, and 13 were classified as macrophages and CRISPLD2+, cancer stem, mast, and endothelial cells, respectively. Clusters 0, 11, 14, and 16 were classified as undefined. (D) Pie chart showing the proportion of each cell type among total cells. Abbreviations: CTEPH: chronic thromboembolic pulmonary hypertension; UMAP: Uniform Manifold Approximation and Projection; CRISPLD2: cysteine-rich secretory protein LCCL domain containing 2.