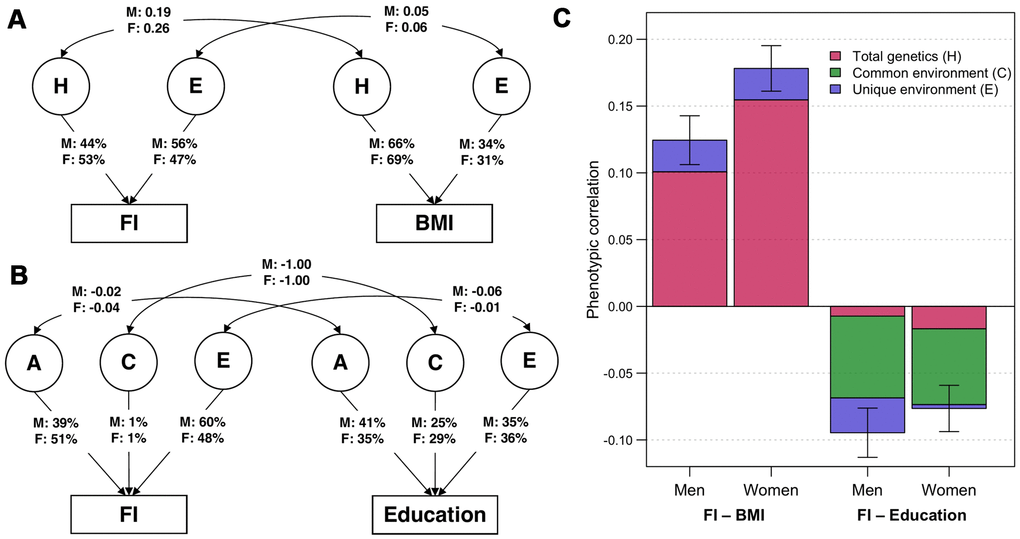
Figure 1.Parameter estimates from the best-fitting bivariate twin models. (A) ADE bivariate quantitative sex-limitation model between frailty index (FI) and body mass index (BMI), adjusted for age. Single headed-arrows represent the proportion of each traits explained by latent (circular) variance components; while double-headed arrows represent correlations between variance components. H indicates the sum of additive and dominance genetic factors; E indicates unique environmental factors; M and F are the estimates for men and women respectively. (B) ACE bivariate quantitative sex-limitation model between FI and education, adjusted for age. A indicates additive genetic factors; C indicates common environmental factors. (C) Phenotypic correlations of FI with BMI and education among men and women (with 95% confidence intervals), and the proportion of correlations explained by total genetic, common environmental and unique environmental factors. Note: Model-fitting results and parameter estimates can be found in Supplementary Tables 3, 4.