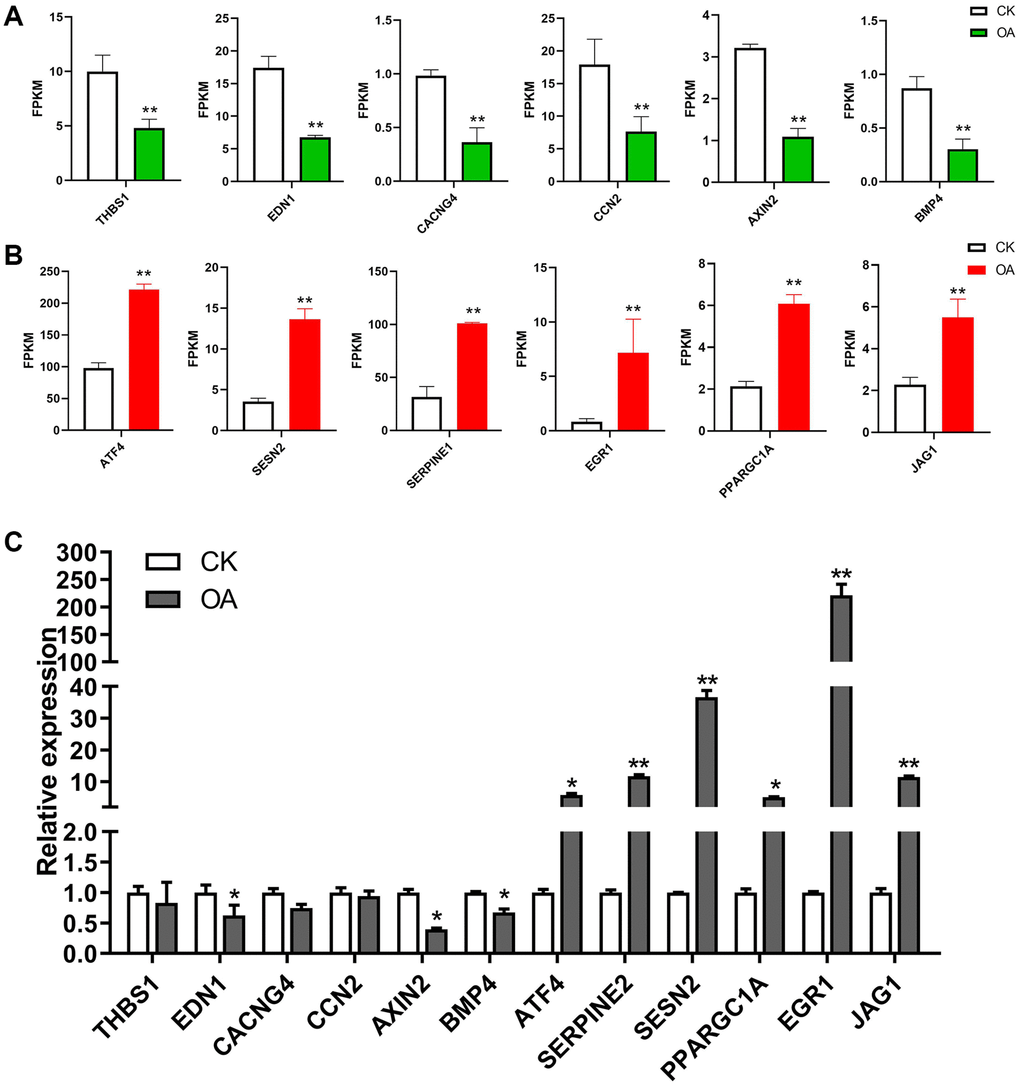
Figure 5.The regulation of target genes in response to OA treatment. (A) The bar plots show the expression values of six downregulated genes in RNA-seq data, including THBS1, EDN1, CACNG4, CCN2, AXIN2 and BMP4. (B) The bar plots show the expression values of six upregulated genes in RNA-seq data, including ATF4, SERPINE1, SESN2, PPARGC1A, EGR1 and JAG1. (C) The bar plots show the expression values of above 12 genes based on qPCR results.*p < 0.05, **p < 0.01.