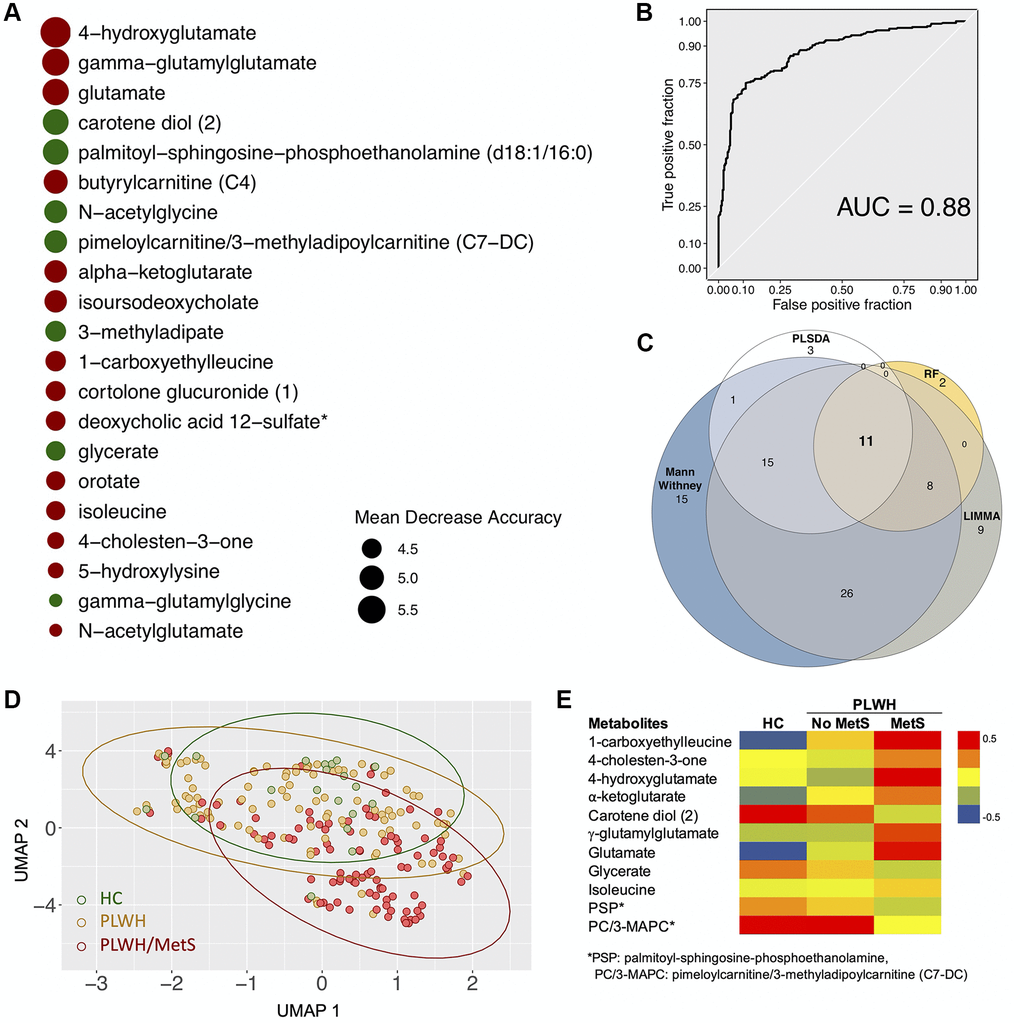
Figure 2.Biomarkers (n = 11) with differential abundance between PLWH and PLWH with MetS identified by four methodologies. (A) Bubble plot representing Random forest variable importance based on mean decrease accuracy (a measure of the model’s performance without each metabolite). Values are scaled by the standard error of the measure. Metabolites represented at the top of the figure are the most important for prediction. (B) Receiver Operating Characteristic (ROC) curve of random forest classifier. (C) Venn diagram summarizing biomarkers identified by Mann-Whitney U test, LIMMA, Random Forest (RF), and PLS-DA. (D) UMAP visualization of the 11 biomarkers. Controls (green) and PLWH (yellow) are segregating from PLWH with MetS (red). (E) Heatmap showing log2 intensities of the 11 biomarkers in HC, PLWH without MetS and PLWH with MetS.