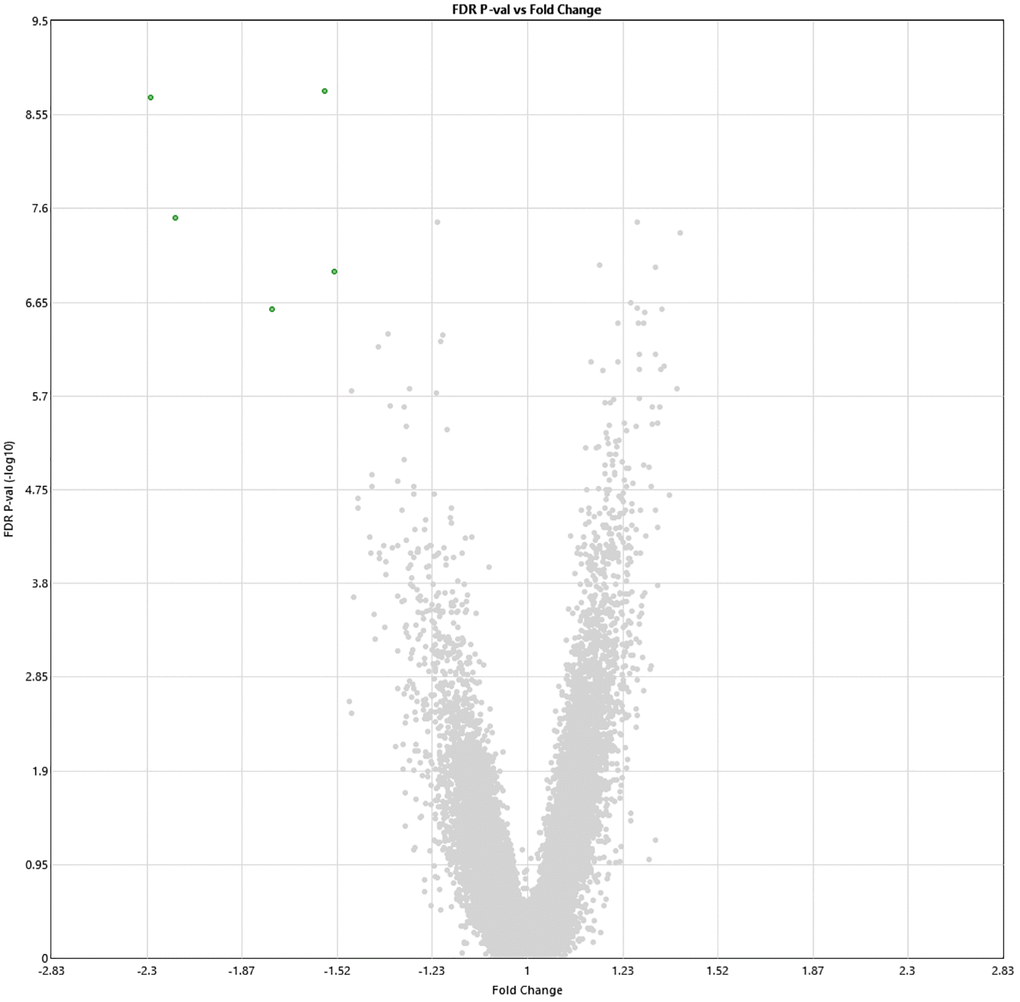
Figure 2.Alterations in gene expression profile following the last HBOT session. Volcano plot showing the distribution of gene expression following 60 HBOT sessions compared to baseline. Significance versus log2 fold change is plotted on the y and x, respectively. Red dots represent the significant upregulated DEGs, green dots represent the significant downregulated DEGs.