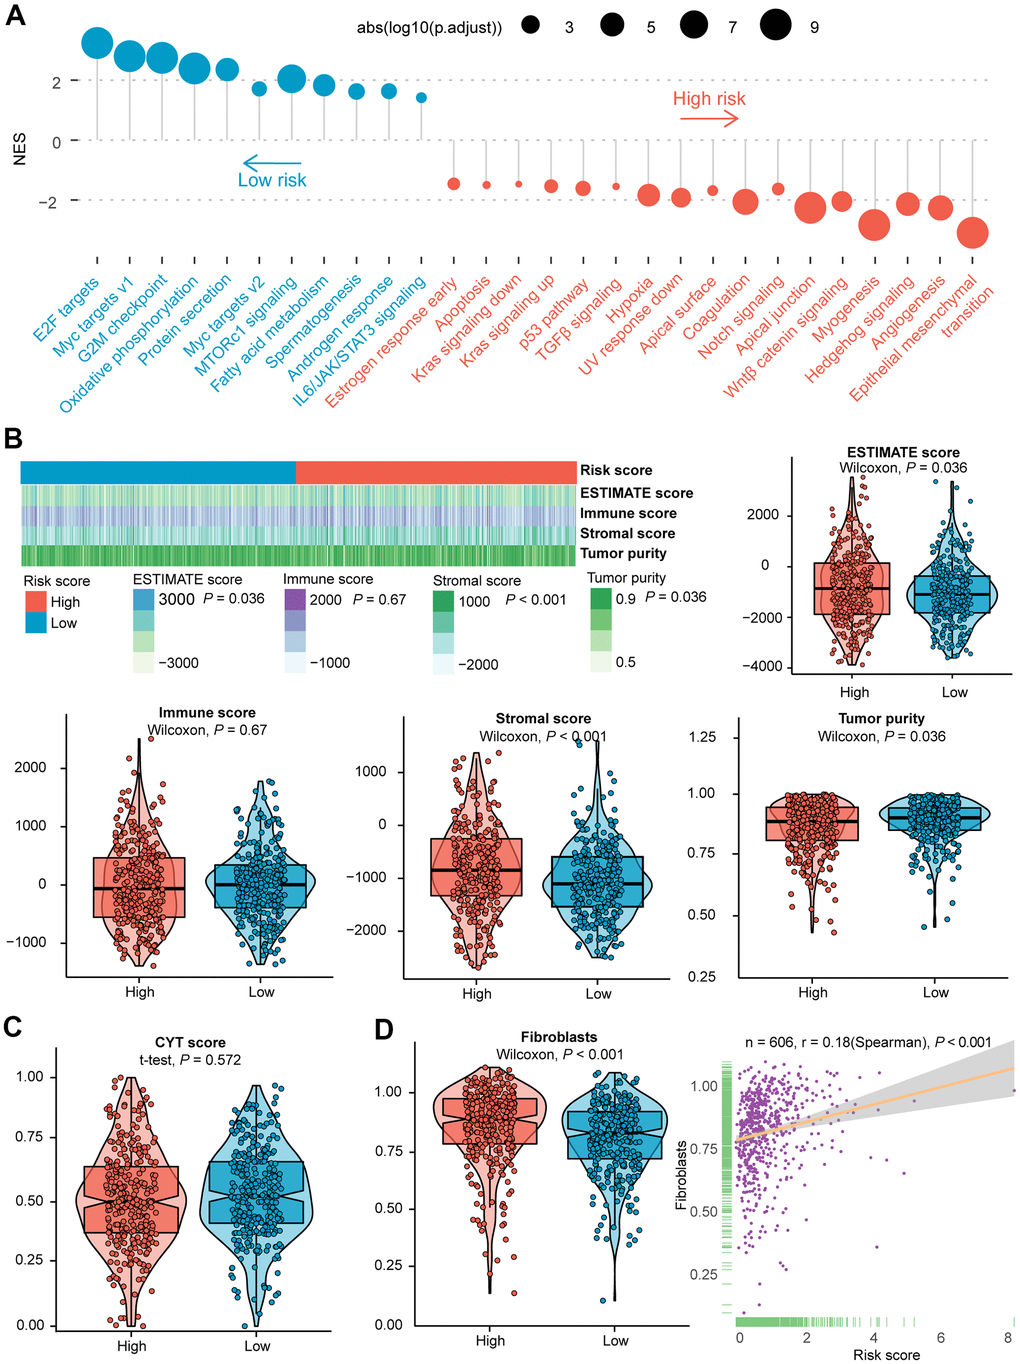
Figure 2.Evaluation of the role of IRGs-based risk score in the training cohort. (A) Results of GSEA of the high-risk group (red) compared with the low-risk group (blue). Color toward gray represents no statistical significance. (B) Heatmap and violin plots of the ESTIMATE score, immune score, stromal score, tumor purity between high- and low- risk subtypes. (C) Violin plot of the CYT score between high- and low- risk subtypes. (D) Violin plot of fibroblasts between two subtypes, and the association between risk score and the NES of fibroblasts. Statistical significance at the level of ns ≥ 0.05, * < 0.05, ** < 0.01 and *** < 0.001. GSEA, gene set enrichment analysis; CYT, cytolytic activity; NES, normalized enrichment score.