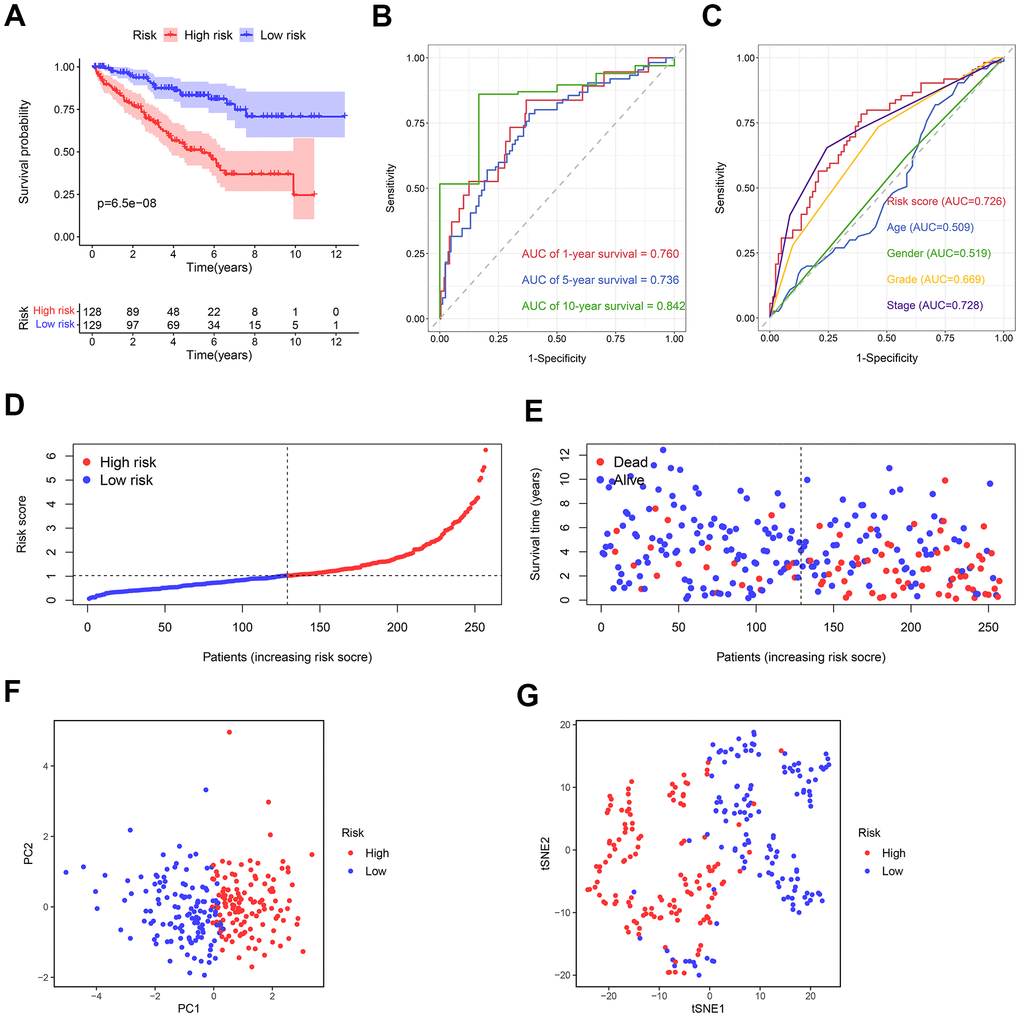
Figure 7.The predictive ability of the prognostic risk model in the training cohort. (A) The OS in the high- and low-risk groups. (B) ROC curves based on the prognostic risk model for predicting the 1-, 5-, and 10-year OS. (C) ROC curves based on the prognostic risk model and clinical parameters for predicting the 5-year OS. (D) Distribution of the risk score. (E) Correlation between the survival status and the risk score. (F) PCA for the high- and low-risk groups. (G) t-SNE analysis for the high- and low-risk groups.