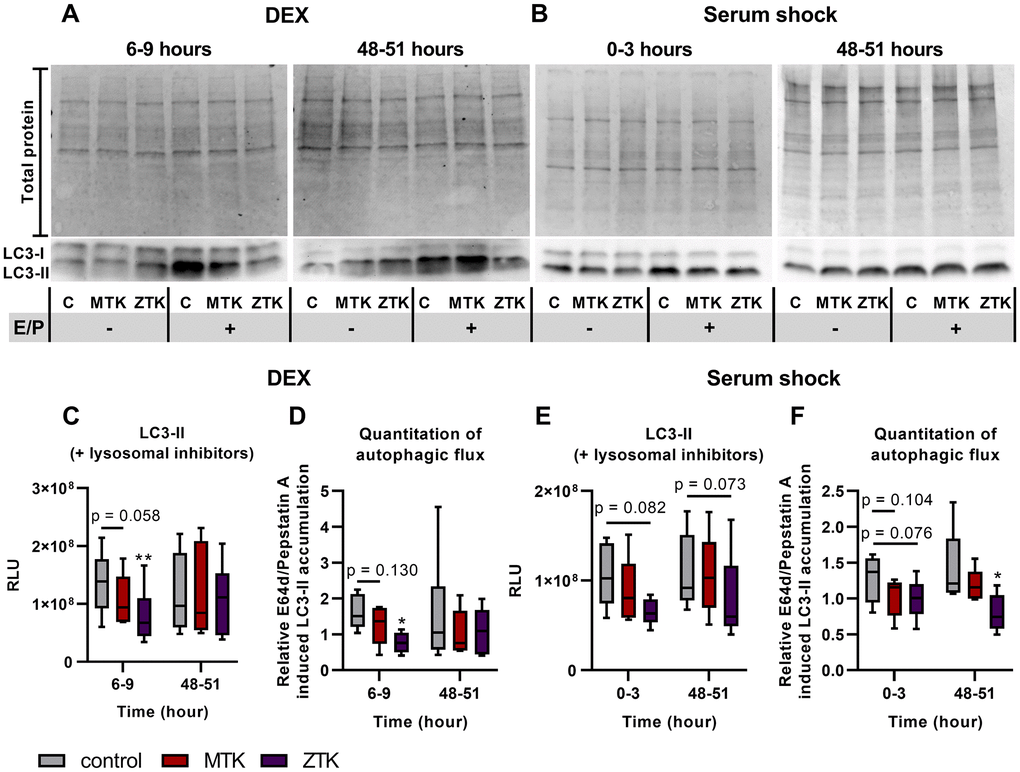
Figure 6.LC3-I and LC3-II protein expression in polarized ARPE-19 cells treated with MTK or ZTK upon DEX treatment and serum shock. Representative western blot analysis showing total protein loading and LC3-I and LC3-II expression at (A) 6 hours and 48 hours upon DEX treatment and (B) directly after and 48 hours upon serum shock in polarized ARPE-19 cells treated with 100 nM MTK or 100 nM ZTK in the absence and presence of lysosomal inhibitors E64d and pepstatin A (E/P). (C) RLU levels of LC3-II at 6 hours and 48 hours upon DEX treatment in the presence of lysosomal inhibitors for 3 hours in control samples (DMSO) and 100 nM MTK- or 100 nM ZTK-treated polarized ARPE-19 cells. (D) Relative E64d/pepstatin A-induced LC3-II accumulation in control, MTK- and ZTK-treated polarized ARPE-19 cells 6 and 48 hours upon DEX treatment. (E) RLU levels of LC3-II directly after and 48 hours upon serum shock in the presence of lysosomal inhibitors for 3 hours in control samples (DMSO) and 100 nM MTK- or 100 nM ZTK-treated polarized ARPE-19 cells. (F) Relative E64d/pepstatin A-induced LC3-II accumulation in control, MTK- and ZTK-treated polarized ARPE-19 cells directly after and 48 hours upon serum shock. Values are represented in box and whisker plot format (min to max); n = 5–6. The significance of differences in LC3-II expression upon MTK and ZTK treatment was calculated by repeated measures two-way ANOVA (main factors: time and treatment (matched)) followed by a Dunnett multiple comparison test. *p < 0.05, **p < 0.01. Western blot images are cropped showing areas of marked primary antibody interaction only.