Submit an Article
Navigate
Home
Editorial Board
Editorial Policies
Current Volume
Archive
Scientific Integrity
Publication Ethics Statements
Interviews with Outstanding Authors
Newsroom
Sponsored Conferences
Podcast
Contact
Special Collections
Submit an Article
Online ISSN: 1945-4589
Research Paper
|
Volume 13, Issue 24
|
pp. 25729–25738
Factors influencing serum neurofilament light chain levels in normal aging
Back to article
Figure 1
(1 of 2)
−
100%
+
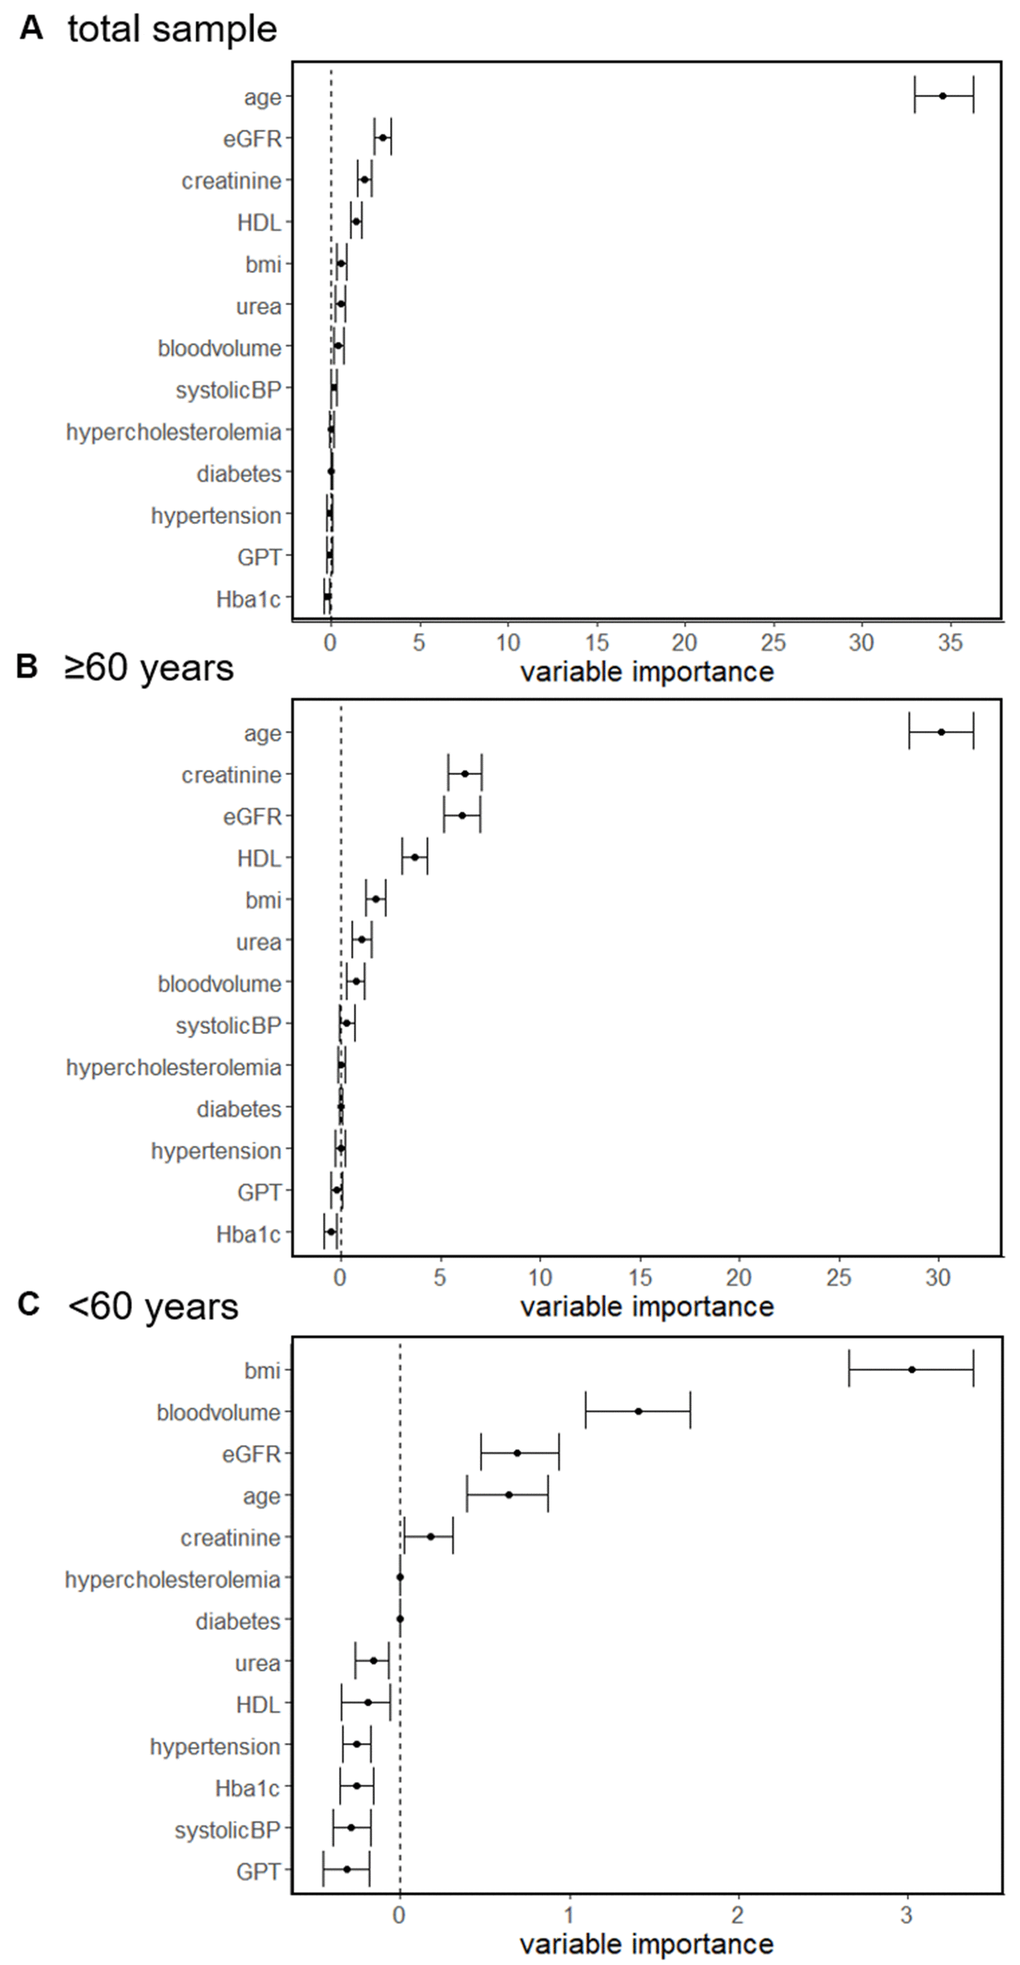
Figure 1.
Random forest regressions of determinants associated with sNfL concentration in the total sample (
A
), individuals ≥60 years (
B
) and <60 years (
C
).
Figure 1 — Factors influencing serum neurofilament light chain levels in normal aging | Aging