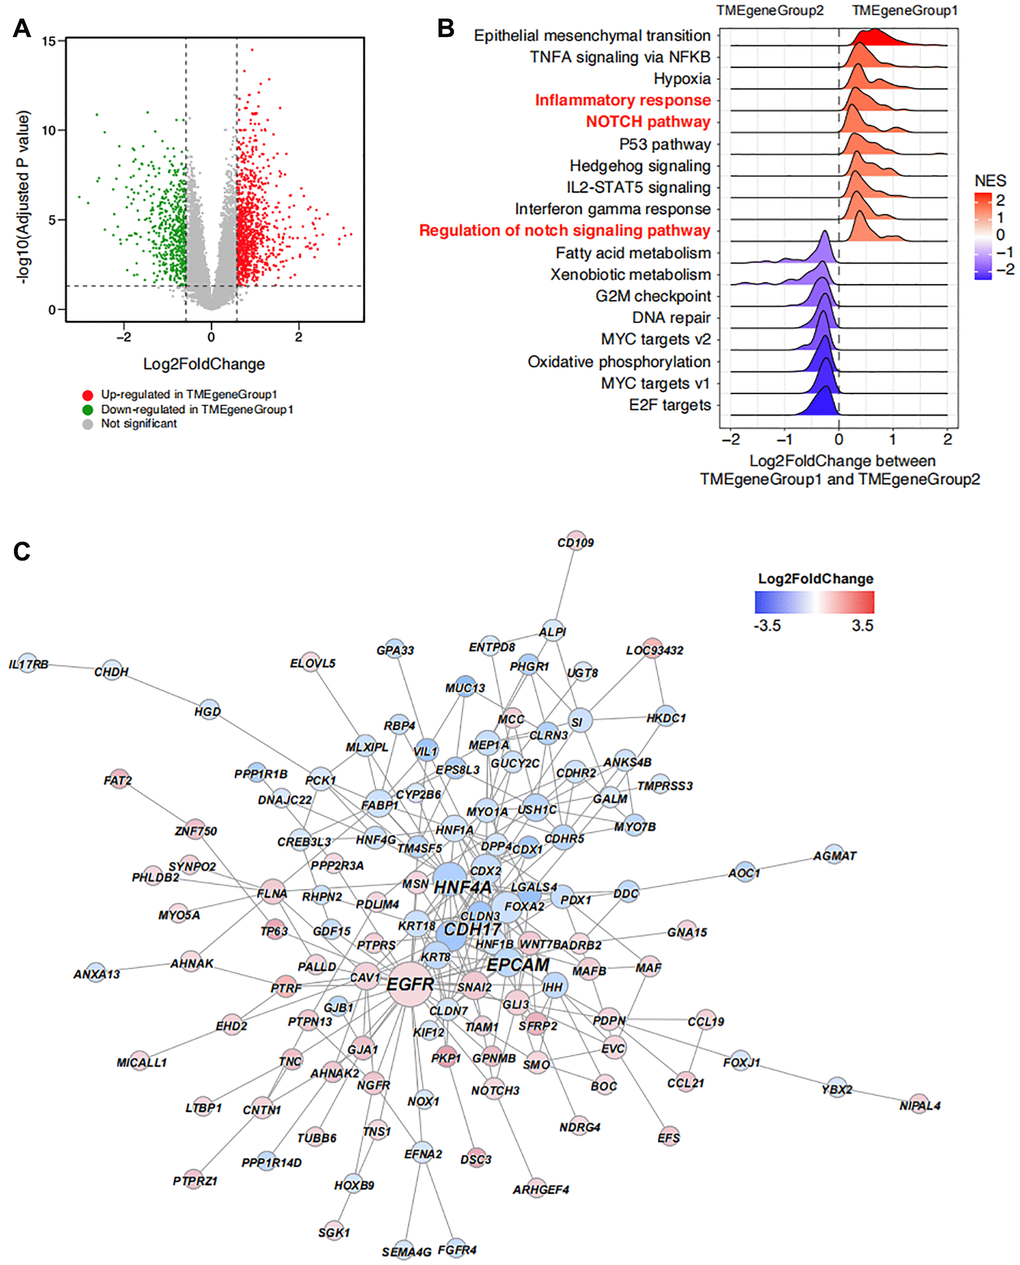
Figure 4.Unsupervised clustering enrichment analysis of DEGs. (A) DEGs between TMEgeneGroup1 and TMEgeneGroup2. The x axis corresponds to log2 transformed fold change value, and the y axis corresponds to –log10 transformed adjusted P value. Up- and down- regulated genes in TMEgeneGroup1 are shown as red and blue dots. (B) GSEA analysis shows the top enriched pathways between TMEgeneGroup1 and TMEgeneGroup2. Pathways were ordered by NES and all pathways had P values less than 0.05. (C) PPI network of the DEGs between TMEgeneGroup1 and TMEgeneGroup2. Up- and down- regulated genes in TMEgeneGroup1 are colored in red and blue. Size of nodes and gene labels correspond to the hub score of genes.